A recent Gallup poll found that Americans’ rating of the environment has reached a new all-time low, with 66 percent of respondents saying the environment is getting worse. The only problem? The data show the exact opposite is happening.
Perception vs. Reality
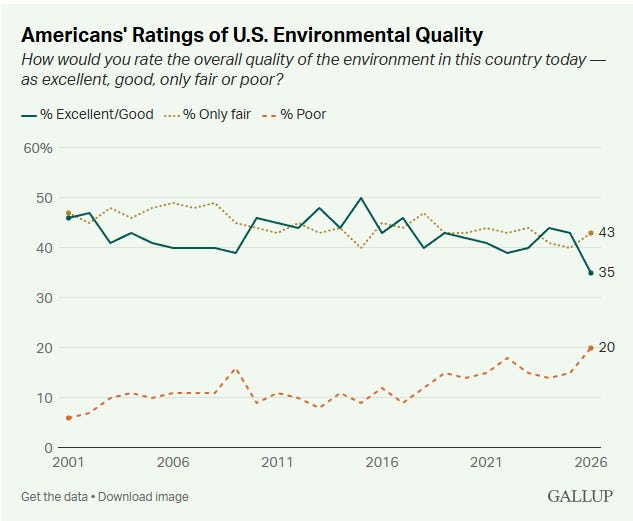
According to Gallup, only 35 percent of Americans rate environmental quality as excellent or good, the lowest point since the survey began in 2001. In contrast, 20 percent now believe that environmental quality is bad, which is a new high.
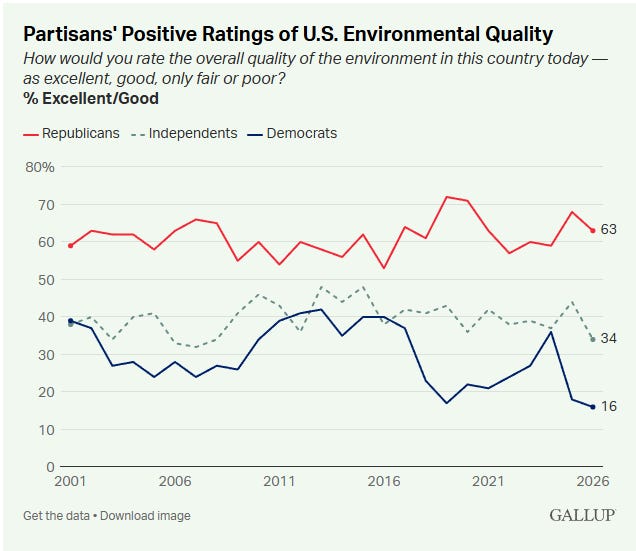
According to Gallup, the decline is driven mostly by independents, whose rating has fallen by 10 points since last year. Gallup data shows Republicans are consistently the demographic that believes that the environment is good, and Democrats are the most likely to think environmental quality is poor.
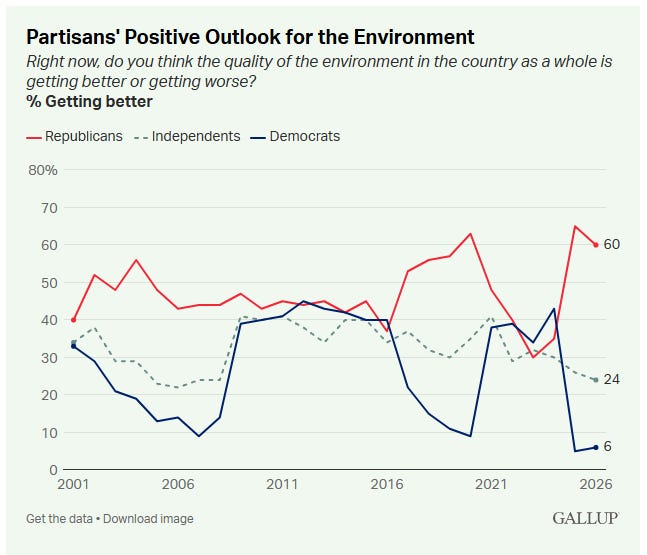
Interestingly, views on whether the environment is improving or worsening appear to be growing more partisan. Gallup survey data show that Democrats have historically told pollsters they thought the environment was improving during Democratic presidential administrations, but a new trend appears to be emerging where Republicans are now more inclined to view environmental quality through a partisan lens.
Gallup data show 40 to 45 percent of Democrats thought environmental quality was improving during Obama’s presidency. The same belief dropped to 10 percent during Trump’s first term, then shot back up into the 40s when Biden was in office. Now, in Trump’s second term, only 6 percent of Democrats hold the same view. Republicans show the same behavior but in opposite directions—as high as 60 percent of Republicans thought the environment was improving during Trump’s first term, dropping to as low as 30 percent under Biden, and rising back up to the 60s in Trump’s second term.
It’s Getting Better All The Time
The problem with the survey responses discussed above is that beliefs about the environment are largely detached from the actual data.
All measurable air quality metrics have shown consistent improvement over the last 25 years, regardless of which party controls the White House, and the trends are even starker when we examine the entirety of U.S. Environmental Protection Agency (EPA) air pollution data going back to 1970.
Air quality in the United States has been improving, not worsening, over the last five decades, and emissions in the country have fallen dramatically. The data below highlights just how much.
Criteria Pollutant Trends
EPA data show massive drops in pollutants like nitrous oxides (NOx), sulfur dioxide (SO2), and small particulate matter (PM). EPA measures two types of particulate matter pollution, those 10 micrometers in diameter (PM10), and 2.5 micrometers in diameter (PM2.5)
NOx
The graph below shows NOx data going back to 1970 for the four major source categories: power plants, industrial fuels, highway vehicles, and non-highway vehicles, and the total U.S. emissions during this time.
EPA data show that power plant NOx emissions fell from 4.9 million tons in 1970 to 751,000 tons in 2024, a drop of 85 percent over this period. Total emissions fell by 74 percent.
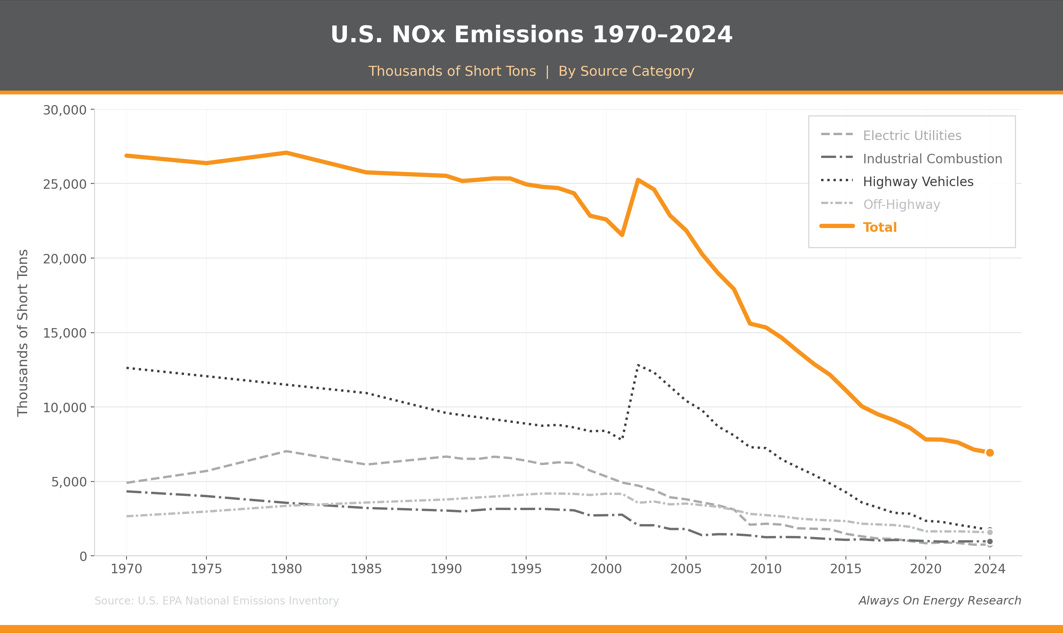
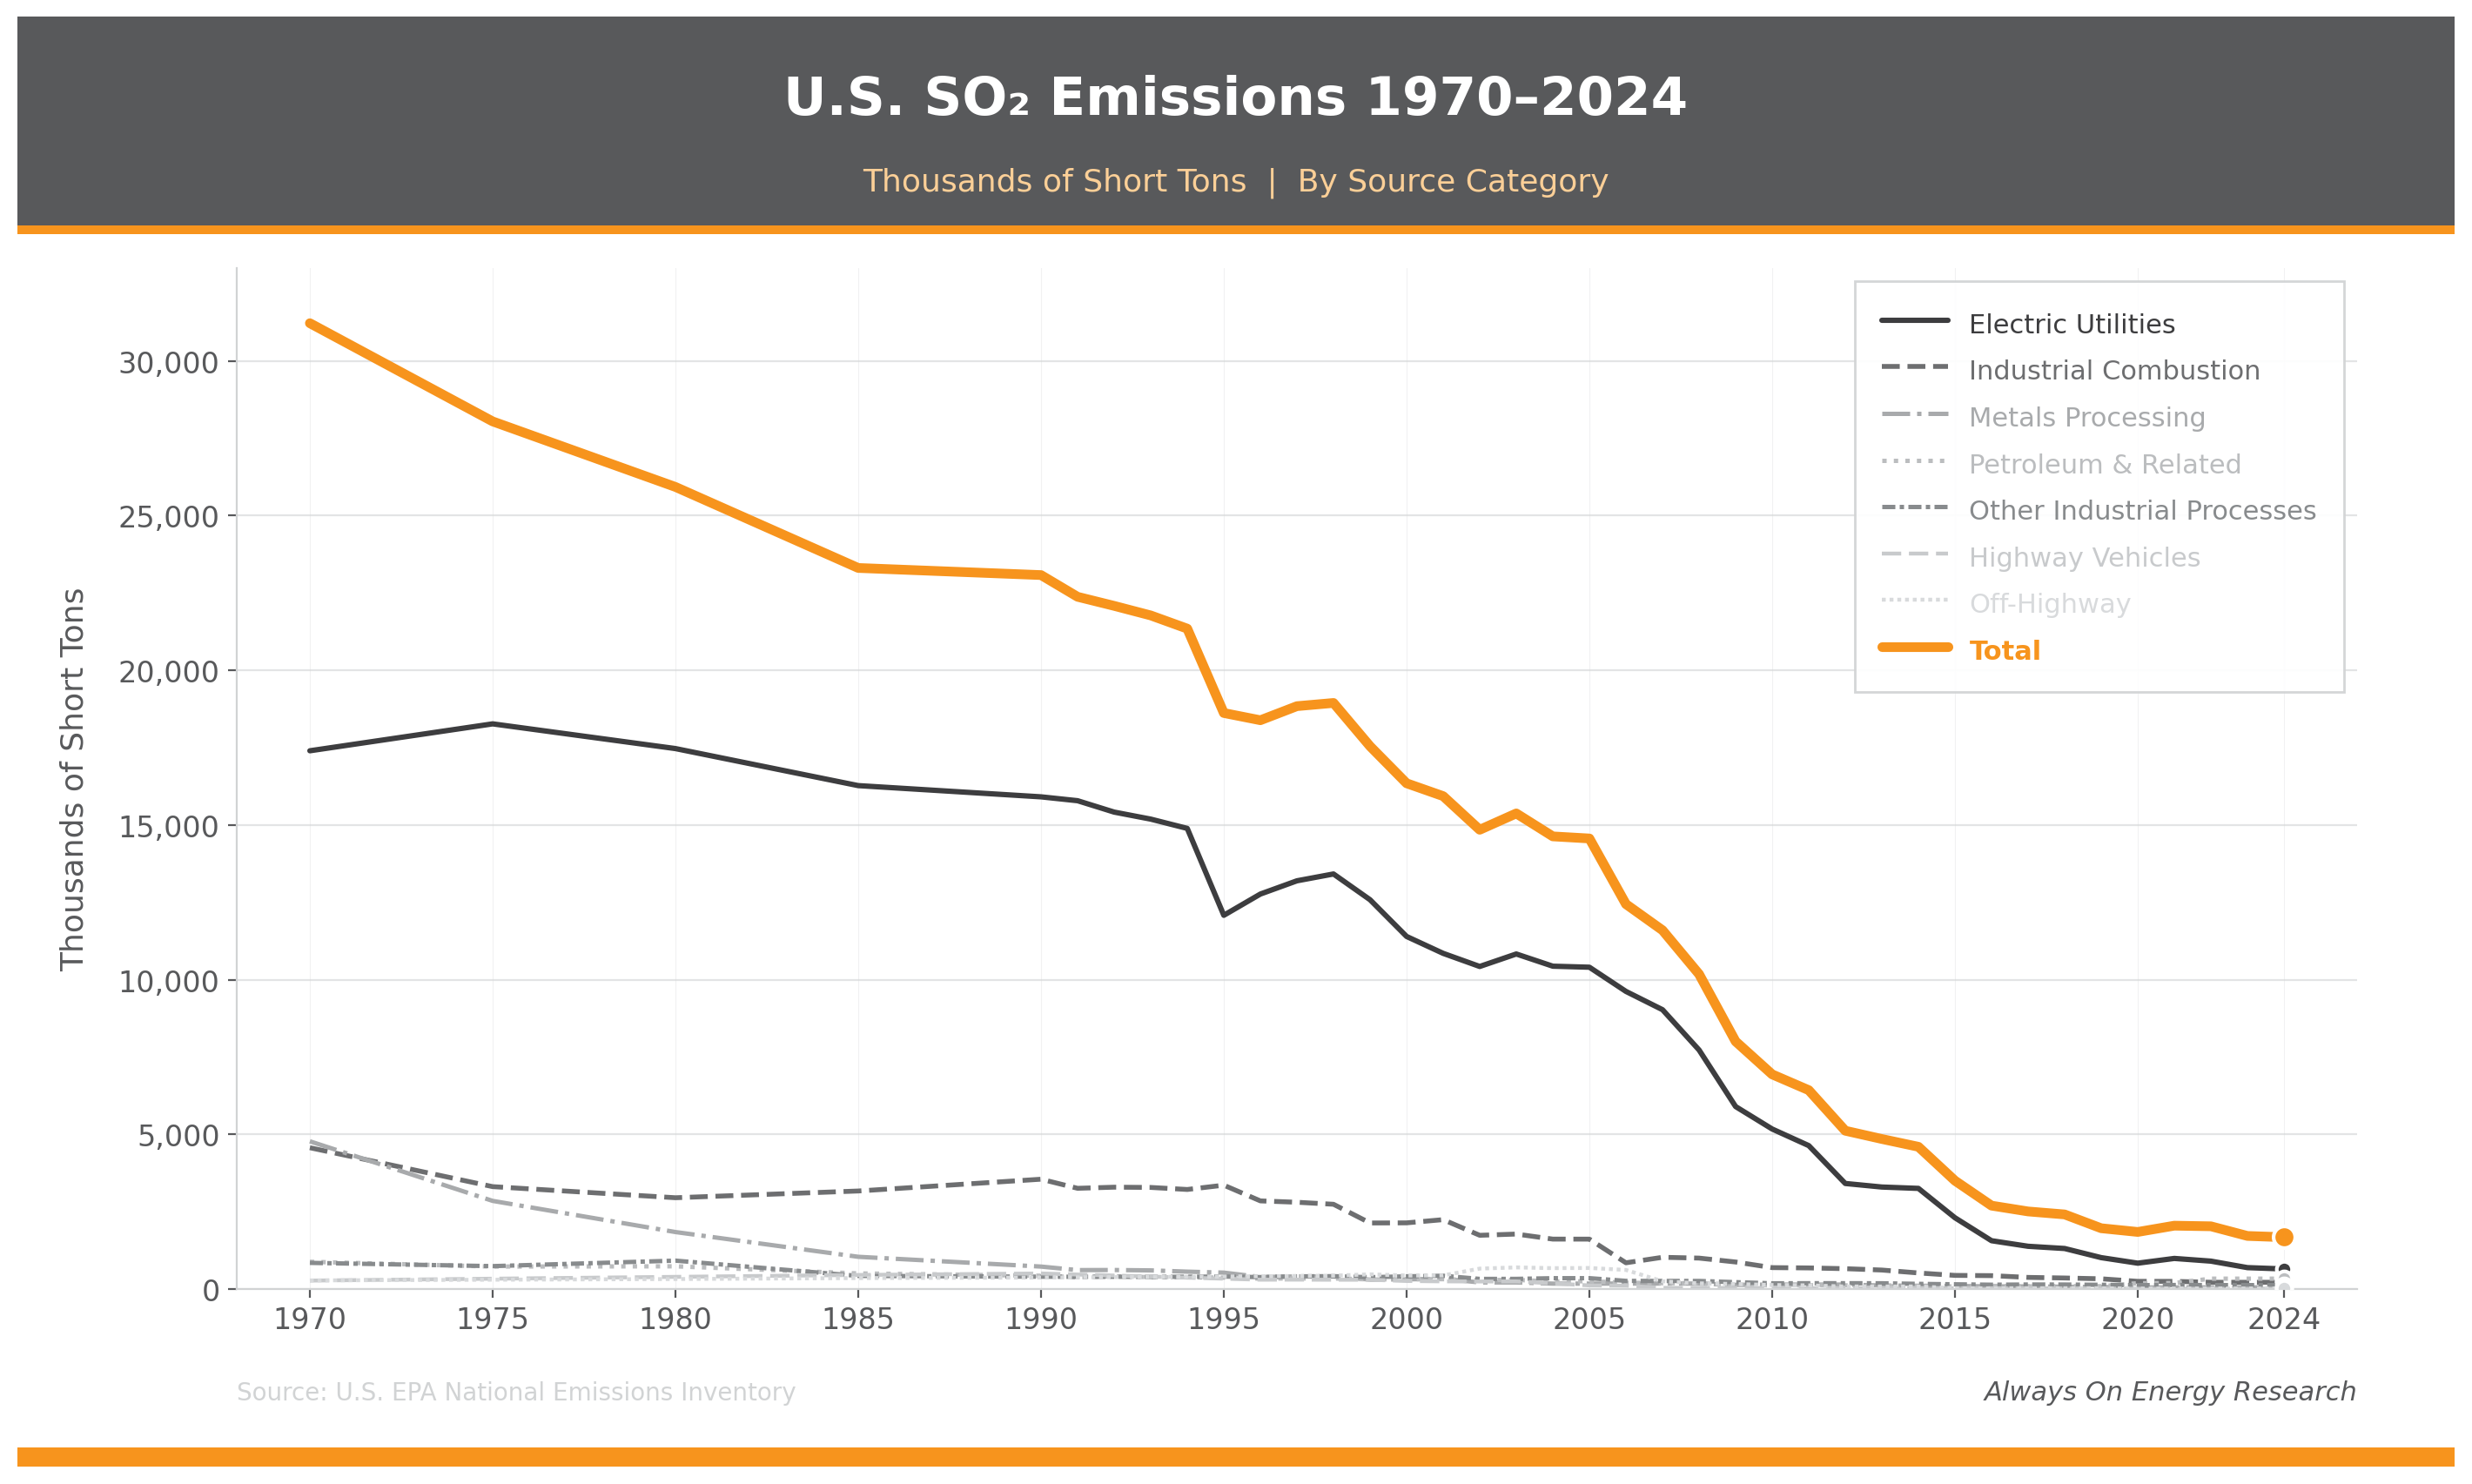
It is worth noting that the graph above shows that the vast majority of these pollution reductions have occurred since around the year 2000, which coincides with the timeframe of the Gallup survey on environmental sentiment.
SO2
Sulfur dioxide emissions have also fallen dramatically, with SO₂ emissions decreasing by about 95 percent since 1970, while power plant emissions have dropped by roughly 96 percent. Again, the data shows vast improvements since the year 2000.
PM 10 and PM 2.5
PM 10 emissions are largely the result of what the EPA considers “miscellaneous” sources. These include significant volumes of fugitive dust from roads, agriculture, and construction. The sharp increase in the mid-1980s reflects EPA expanding the inventory to include these sources, rather than a real-world surge in emissions.
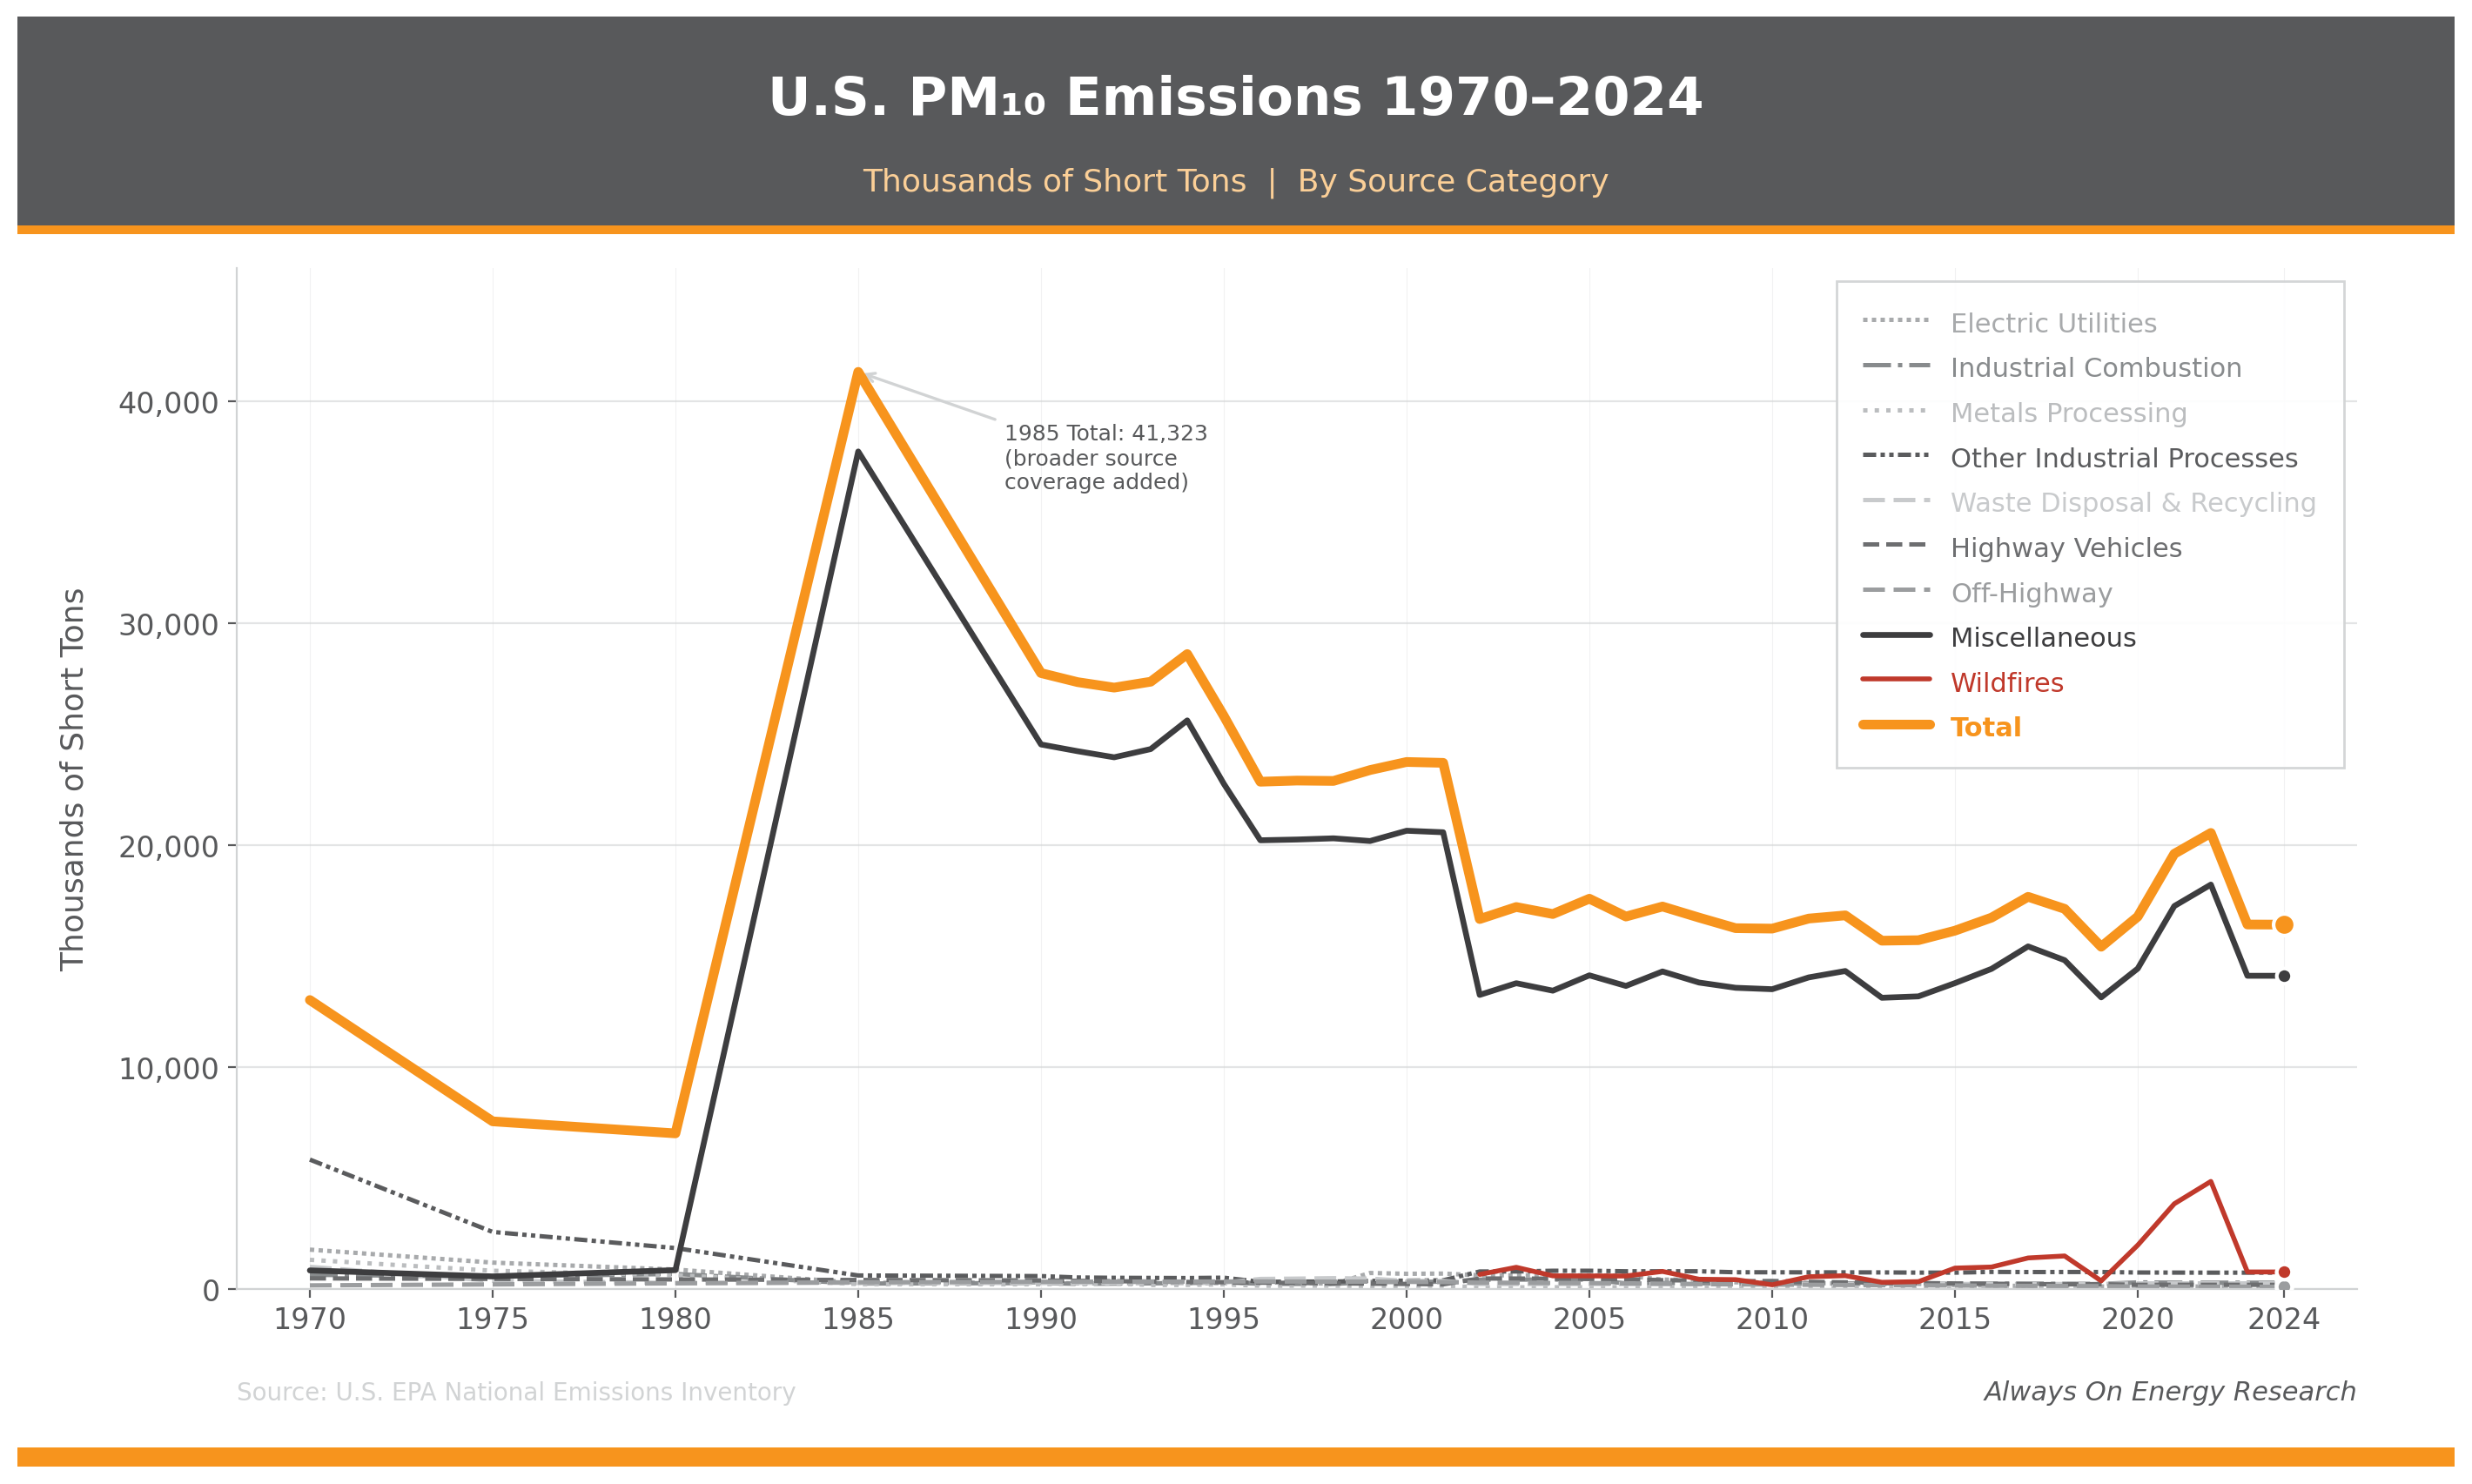
Interestingly, wildfires accounted for 770,000 tons of PM10 in 2024, which was 8 times more than the 94,000 tons emitted by power plants in that year. Overall, power plants accounted for 0.6 percent of U.S. PM 10 emissions.
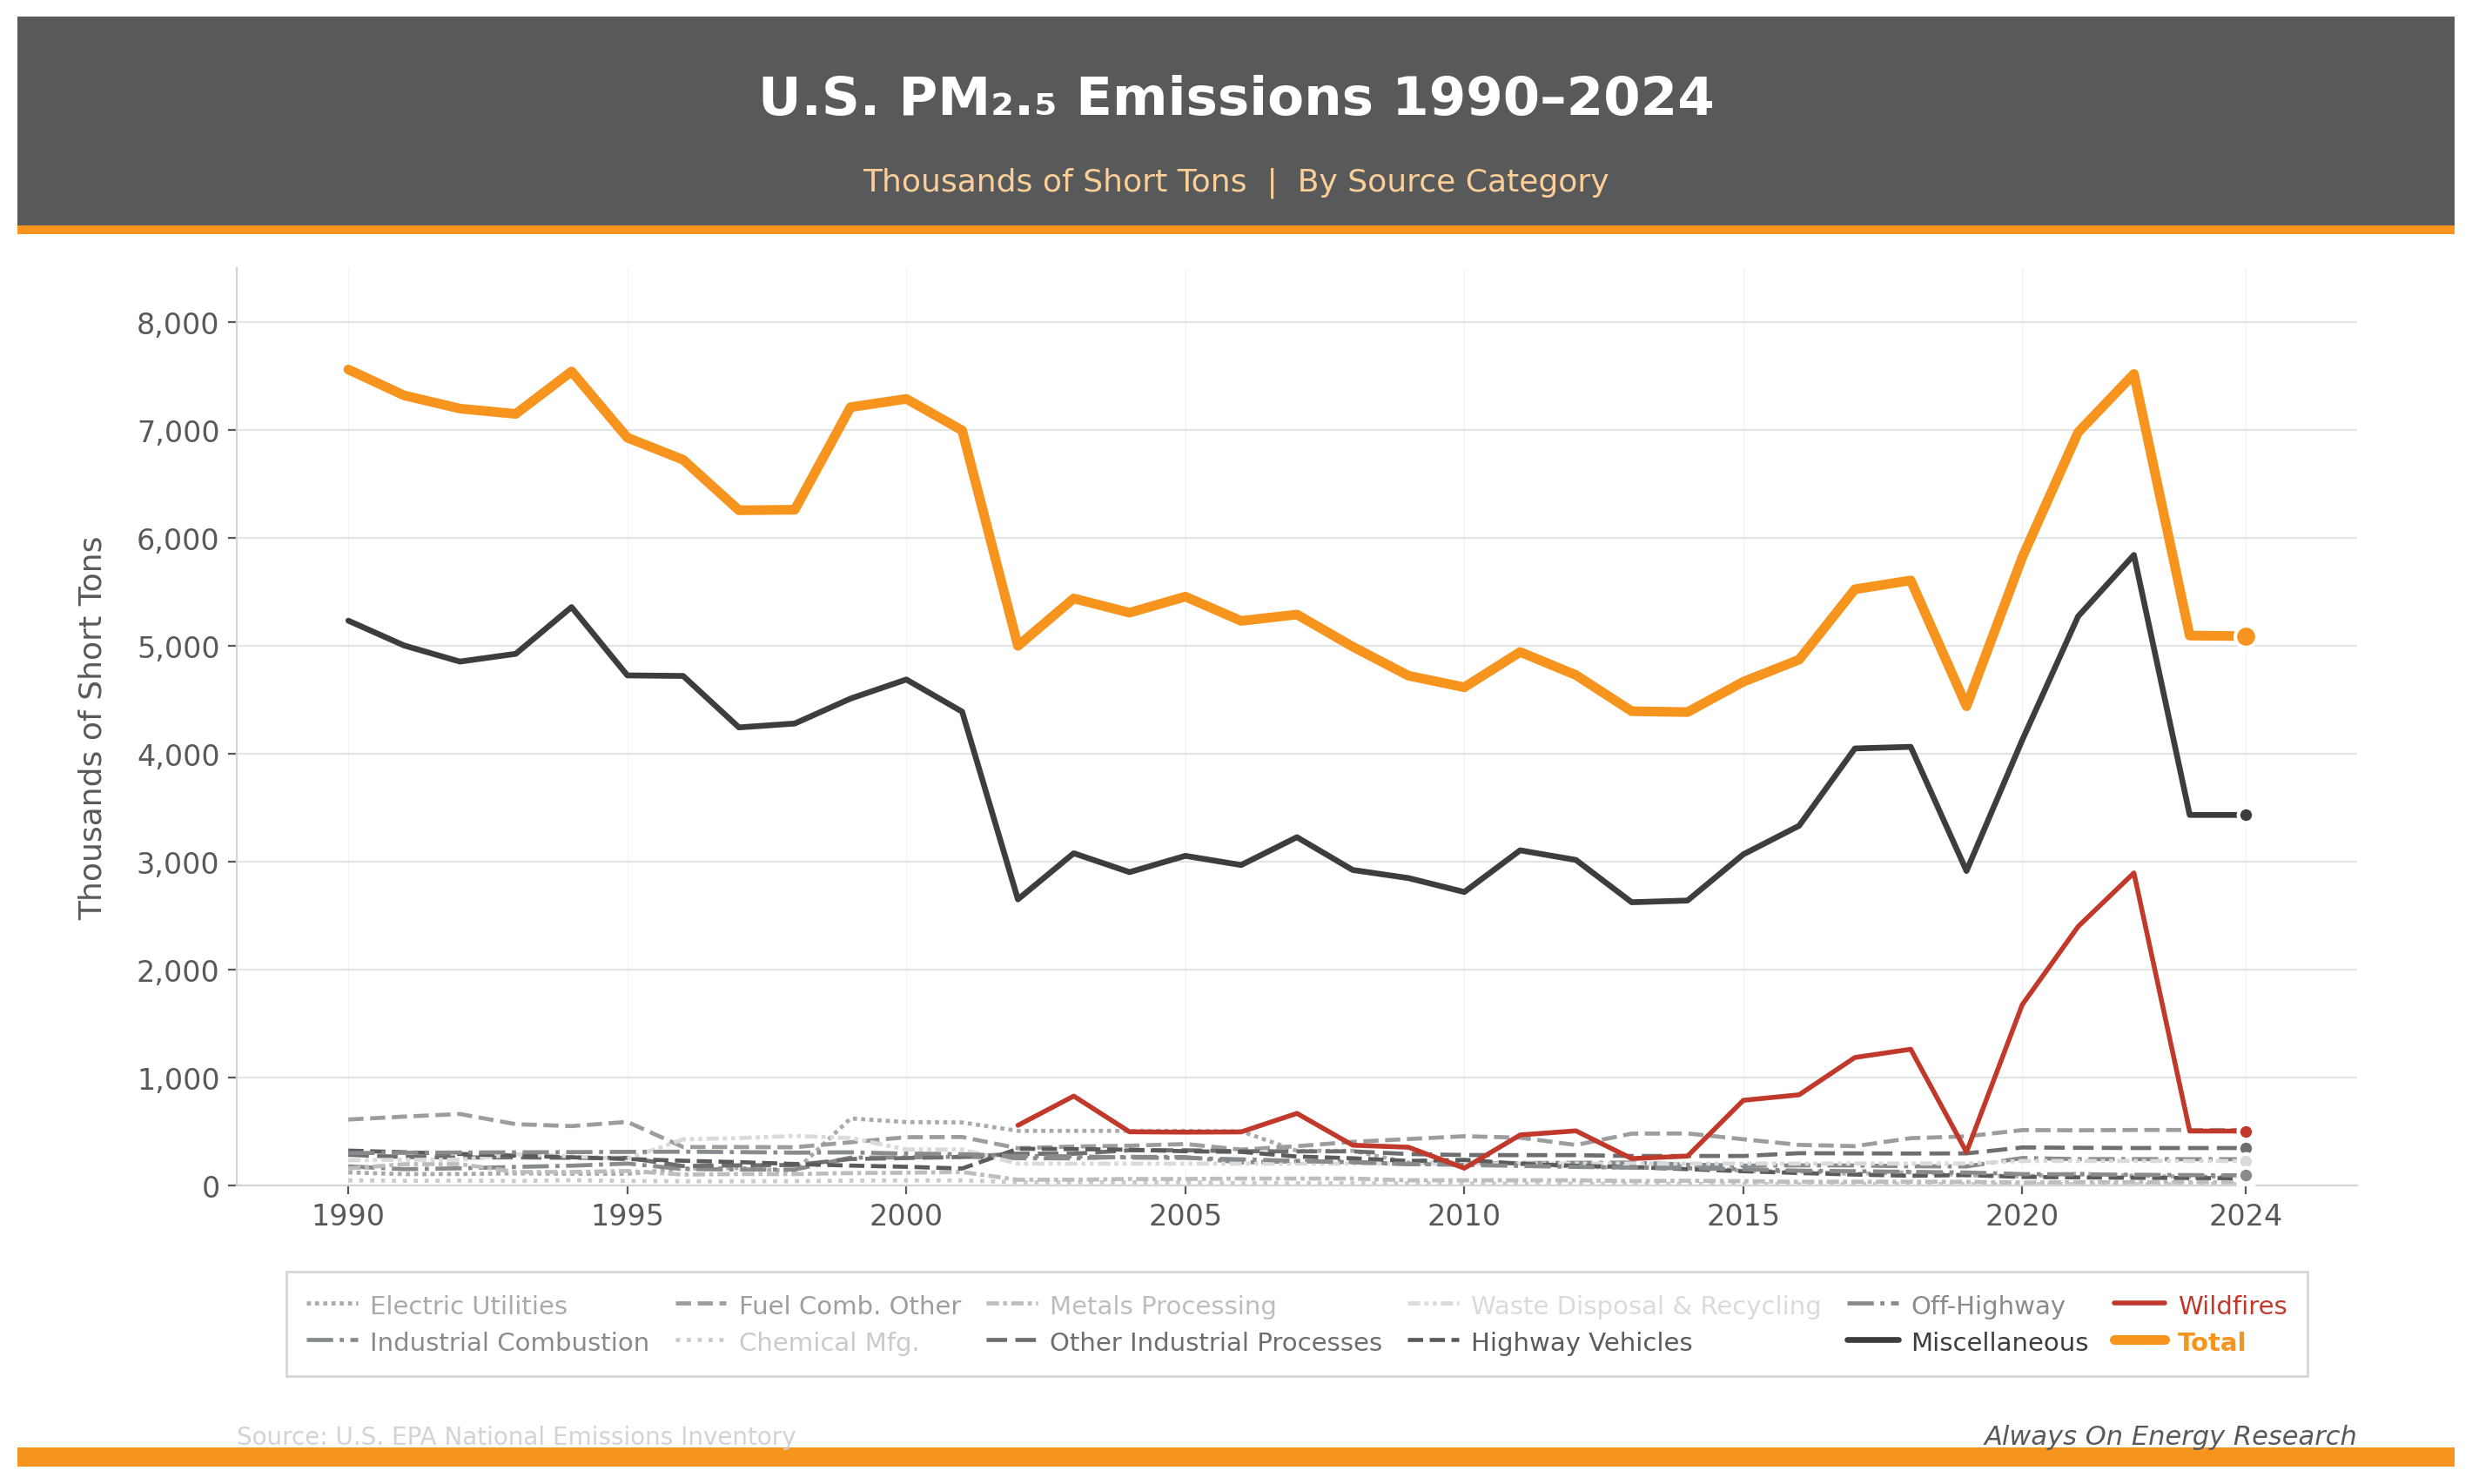
It is a similar story for PM2.5, which is dominated by the miscellaneous category and, more recently, wildfire smoke.
Carbon Monoxide
Carbon monoxide (CO) emissions have fallen by 78 percent since 1970, but power plant CO emissions have risen slightly over the same period. However, despite a slight rise since 1970, power plants accounted for less than 1 percent of total U.S. CO emissions in 2024, and the decline in emissions is closely linked to the main source: vehicles.
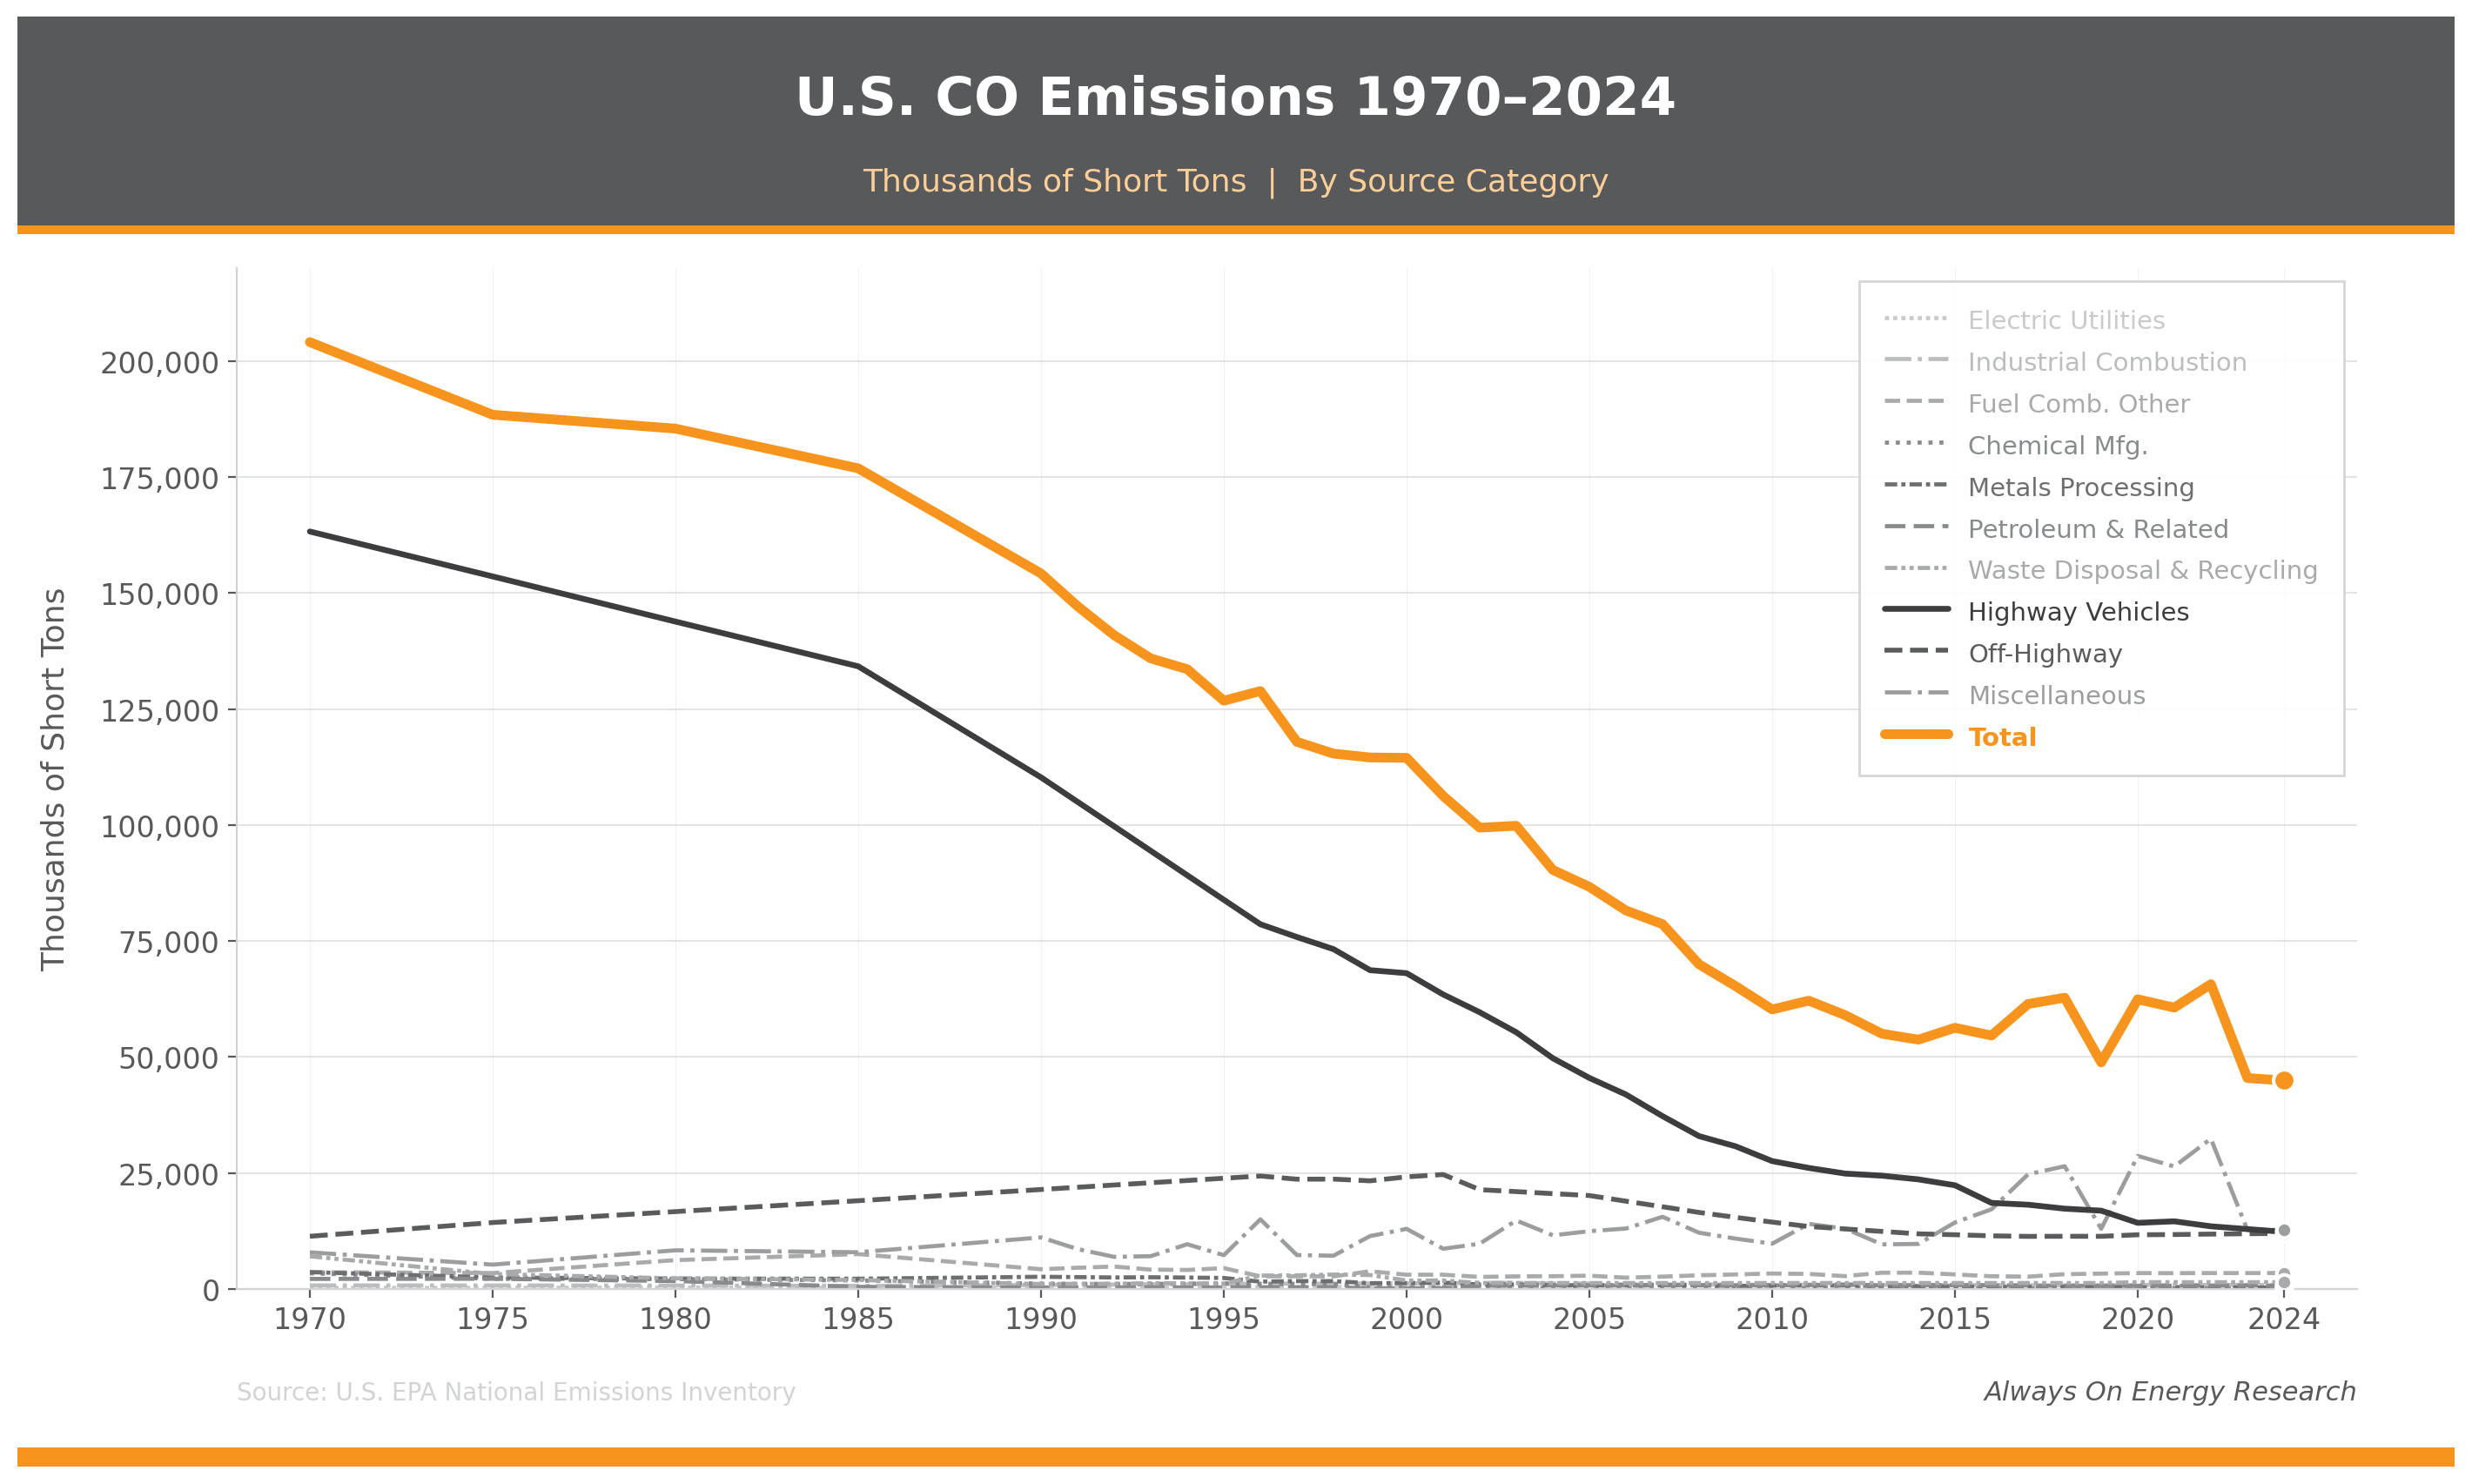
Ironically, rising CO emissions from power plants may be the result of adding more wind and solar to the grid.
EPA documents explain that CO emissions are largely a byproduct of incomplete combustion at natural gas plants, occurring most frequently during startup, shutdown, and low-load operation. As more wind and solar are added, gas plants are used more flexibly to balance the system, leading to more frequent cycling and longer periods in these operating modes, which increases CO formation.
Mercury
America has made tremendous progress in reducing mercury emissions from power plants. In fact, mercury emissions from U.S. coal plants have plummeted by 93.5 percent since 2008 (before the EPA’s Mercury and Air Toxics Standards were introduced in 2011 and implemented in 2015) while they continued to produce reliable, affordable electricity for the country.
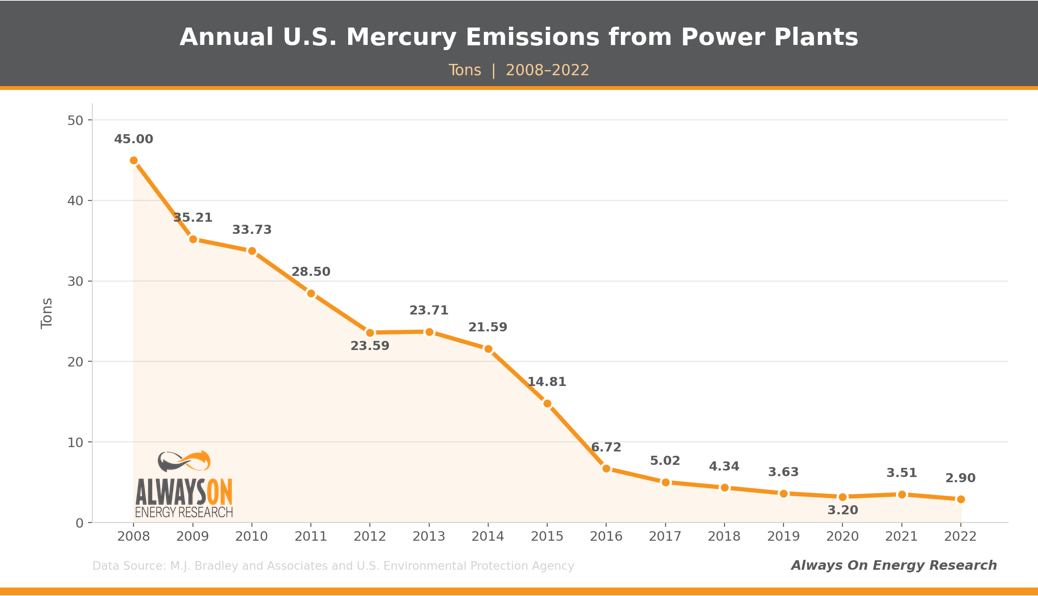
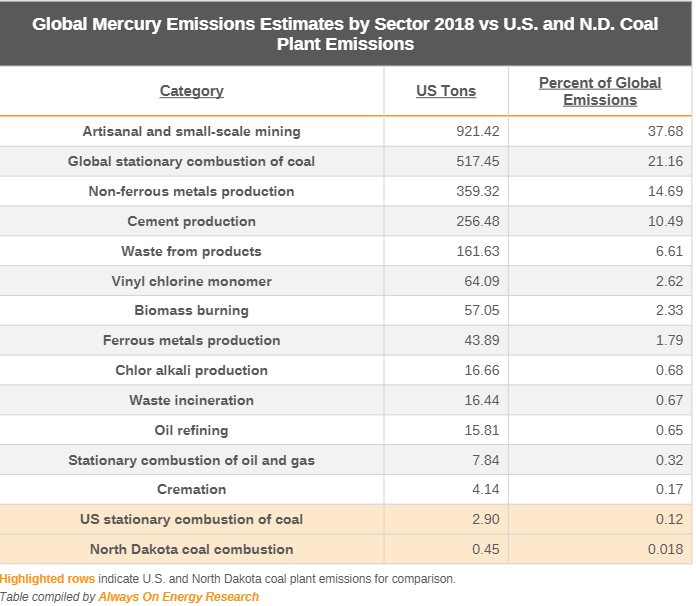
Mercury emissions from U.S. power plants have fallen so much that they produce less mercury than small-scale mining operations in Africa, Asia, and South America, global cement production, and even global cremations, according to the United Nations’ data.
Why Have Emissions Fallen So Far?
Emissions have fallen steadily in the power sector due to pollution controls on power plants, the introduction of catalytic converters on cars, the use of low-sulfur gasoline, and other steps to reduce pollutants spurred by the Clean Air Act and its subsequent amendments.
The graphs below, which use U.S. Energy Information Administration data, show that these pollution control technologies worked to reduce emissions, especially from coal plants, even as coal generation increased from 1990 to its peak in the mid-2000s.
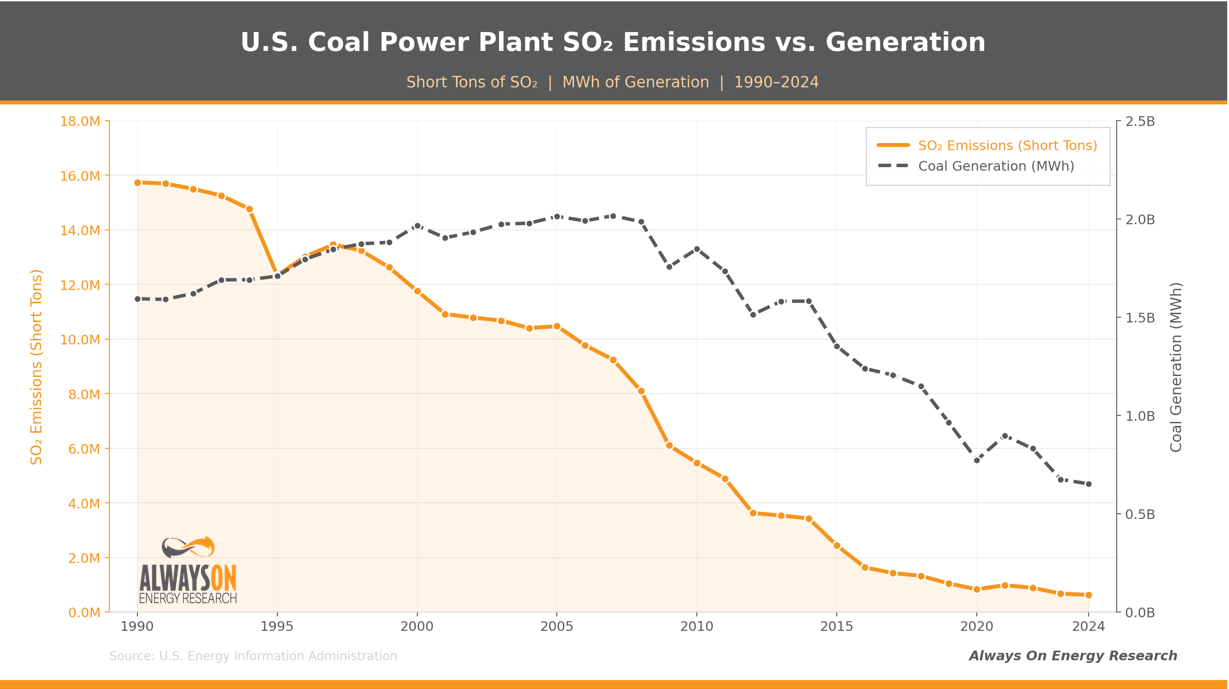
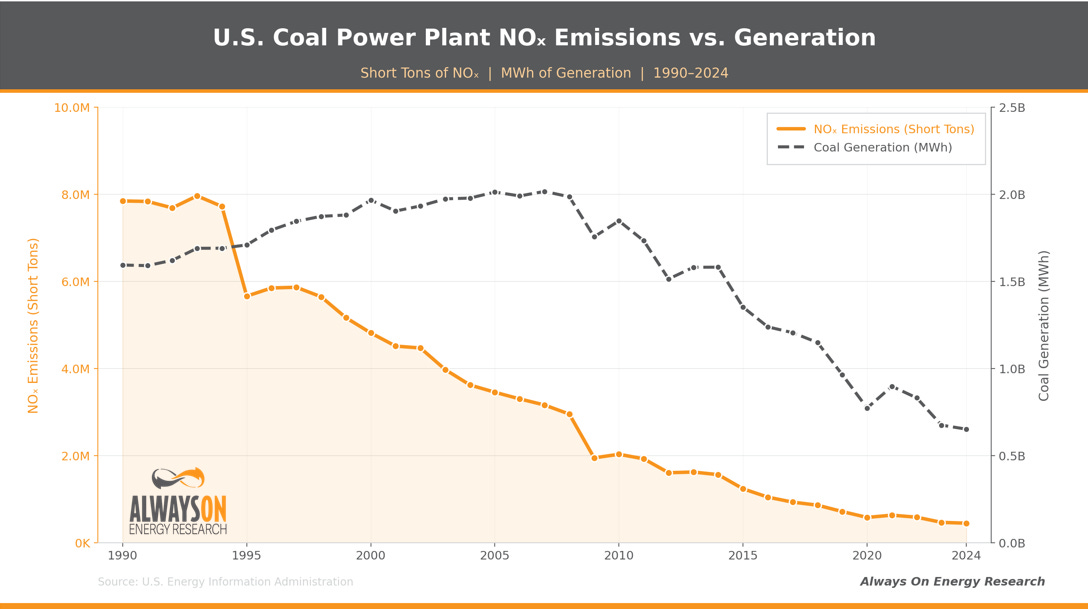
Additionally, the substitution of natural gas, solar, and wind for coal in much of the country also accounted for reductions in coal-plant emissions.
Conclusion
While environmental issues often appear partisan in polls like Gallup’s, the underlying reality tells a different story. Americans of all political stripes can take some comfort in the fact that air quality has steadily improved over time, regardless of which party is in power. In fact, EPA data even suggests that indoor air quality is often worse than outdoor air quality.
This says something about the country as a whole.
Most Americans want a healthy environment—this much we can all agree on. Where the debate tends to break down is around policies that carry significant costs without clear, measurable benefits—such as proposals to transition the electric grid from fuel-based to weather-dependent generation.
This piece was originally published by Isaac Orr and Mitch Rolling on April 25, 2026, at Energy Bad Boys on Substack.