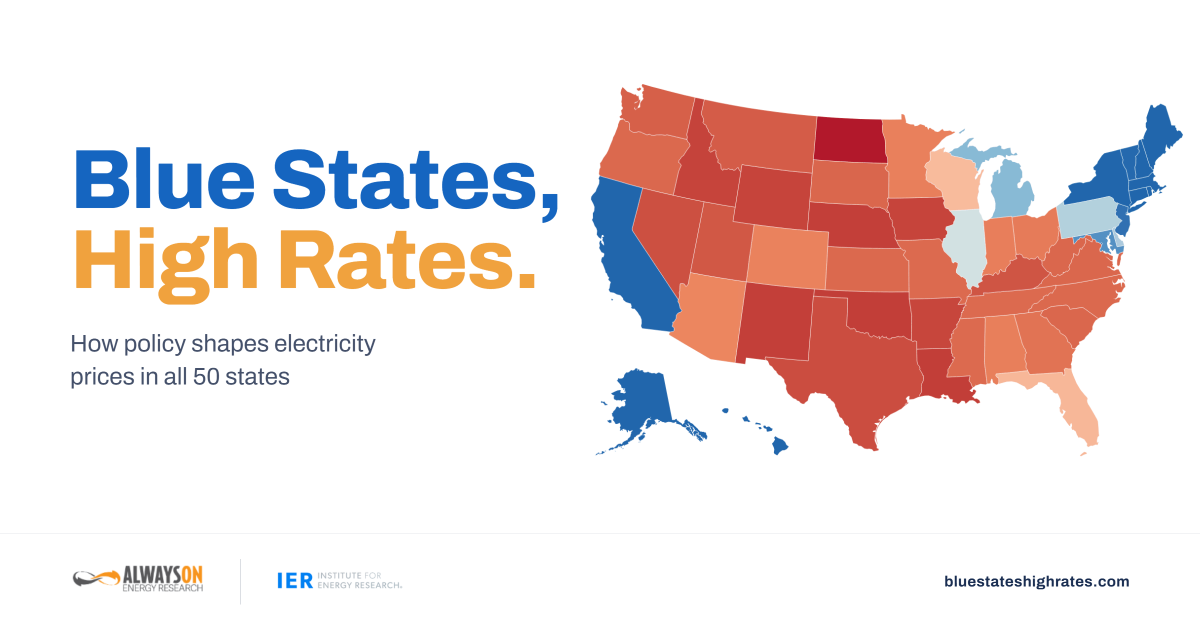
Electricity prices are a policy choice. Blue States, High Rates, the study we published with the Institute for Energy Research in December 2025, found that 86 percent of states with above-average electricity prices are reliably Democratic, while 80 percent of the states with the lowest prices are reliably Republican.
Today the project gets its own home at BlueStatesHighRates.com, where Always On and IER are building it out one state at a time.
Rigorously sourced profiles explain each state’s electricity prices and the policies behind them, including:
- its renewable portfolio standard;
- net metering;
- carbon pricing or cap-and-trade;
- data center consumer protections;
- natural gas access;
- and whether it lets investor-owned utilities adopt net-zero pledges.
We are releasing the first thirteen profiles on July 4, for America’s 250th: the original thirteen colonies. It seems only fitting that the states that declared independence in 1776 are the first profiled in full. The remaining states will follow in the coming weeks.
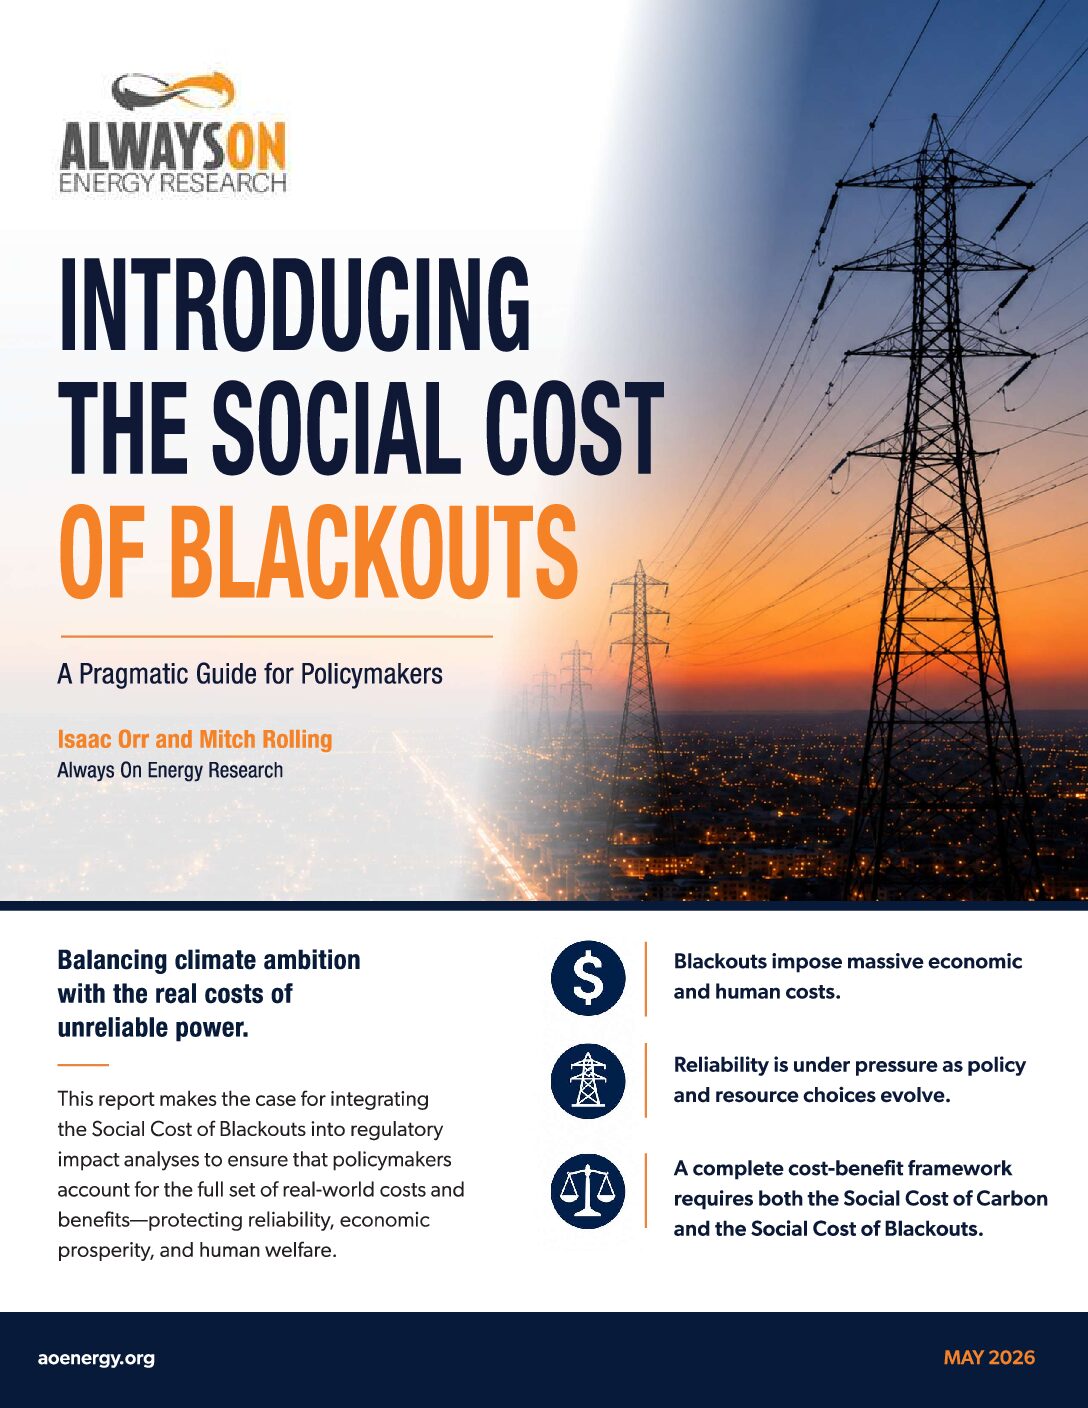
Regulators price the damage from a ton of carbon dioxide but assign no cost to a grid that fails when people need it. That gap lets policymakers count the climate benefits of retiring dispatchable generation while ignoring the cost of the blackouts that follow.
Always On Energy Research is pioneering research Introducing the Social Cost of Blackouts, which quantifies the economic and human costs of power outages caused by regulation. Federal and state regulators routinely apply the Social Cost of Carbon (SCC), a forward-looking estimate of the damage from each incremental ton of emissions, in rulemakings and integrated resource plans. No equivalent metric prices the outages those same rules produce. The report builds one using tools the government and industry already rely on, including the Lawrence Berkeley National Laboratory’s Interruption Cost Estimate (ICE) calculator and standard reliability metrics (SAIDI, SAIFI, CAIDI).
The report applies the method to the Biden EPA’s Final Carbon Rules in the Southwest Power Pool (SPP), using the EPA’s own Integrated Planning Model assumptions and stress-testing the resulting grid against actual hourly wind and solar performance from 2019 through 2023. The results undercut the rule’s economic case:
- Blackouts occur in every historical weather year tested. The 2021 weather year alone produces over 8.3 million MWh of unserved energy through 2055.
- SPP blackout costs run $106 billion to $402 billion through 2047, discounted at the EPA’s own 2 percent rate, against EPA-calculated net benefits of $370 billion for the entire rule nationwide.
- In the worst-case weather year, blackout costs turn the rule’s national net benefits negative, to -$32 billion. Even the best case erases 29 percent of national net benefits, from a region serving just six percent of Americans.
- Blackout costs reach $395 per ton of CO₂ averted in the worst case, 58 percent above the Biden administration’s $250 SCC.
The report lays out a seven-step process any agency can replicate and recommends that the EPA and other federal regulators be required to apply the Social Cost of Blackouts in their cost-benefit analyses, coordinating with FERC and DOE on reliability risk before finalizing a rule. A regulation that prices one externality and ignores the other gives policymakers half the math.
Read the full report, Introducing the Social Cost of Blackouts, at this link. Direct media inquiries to [email protected].
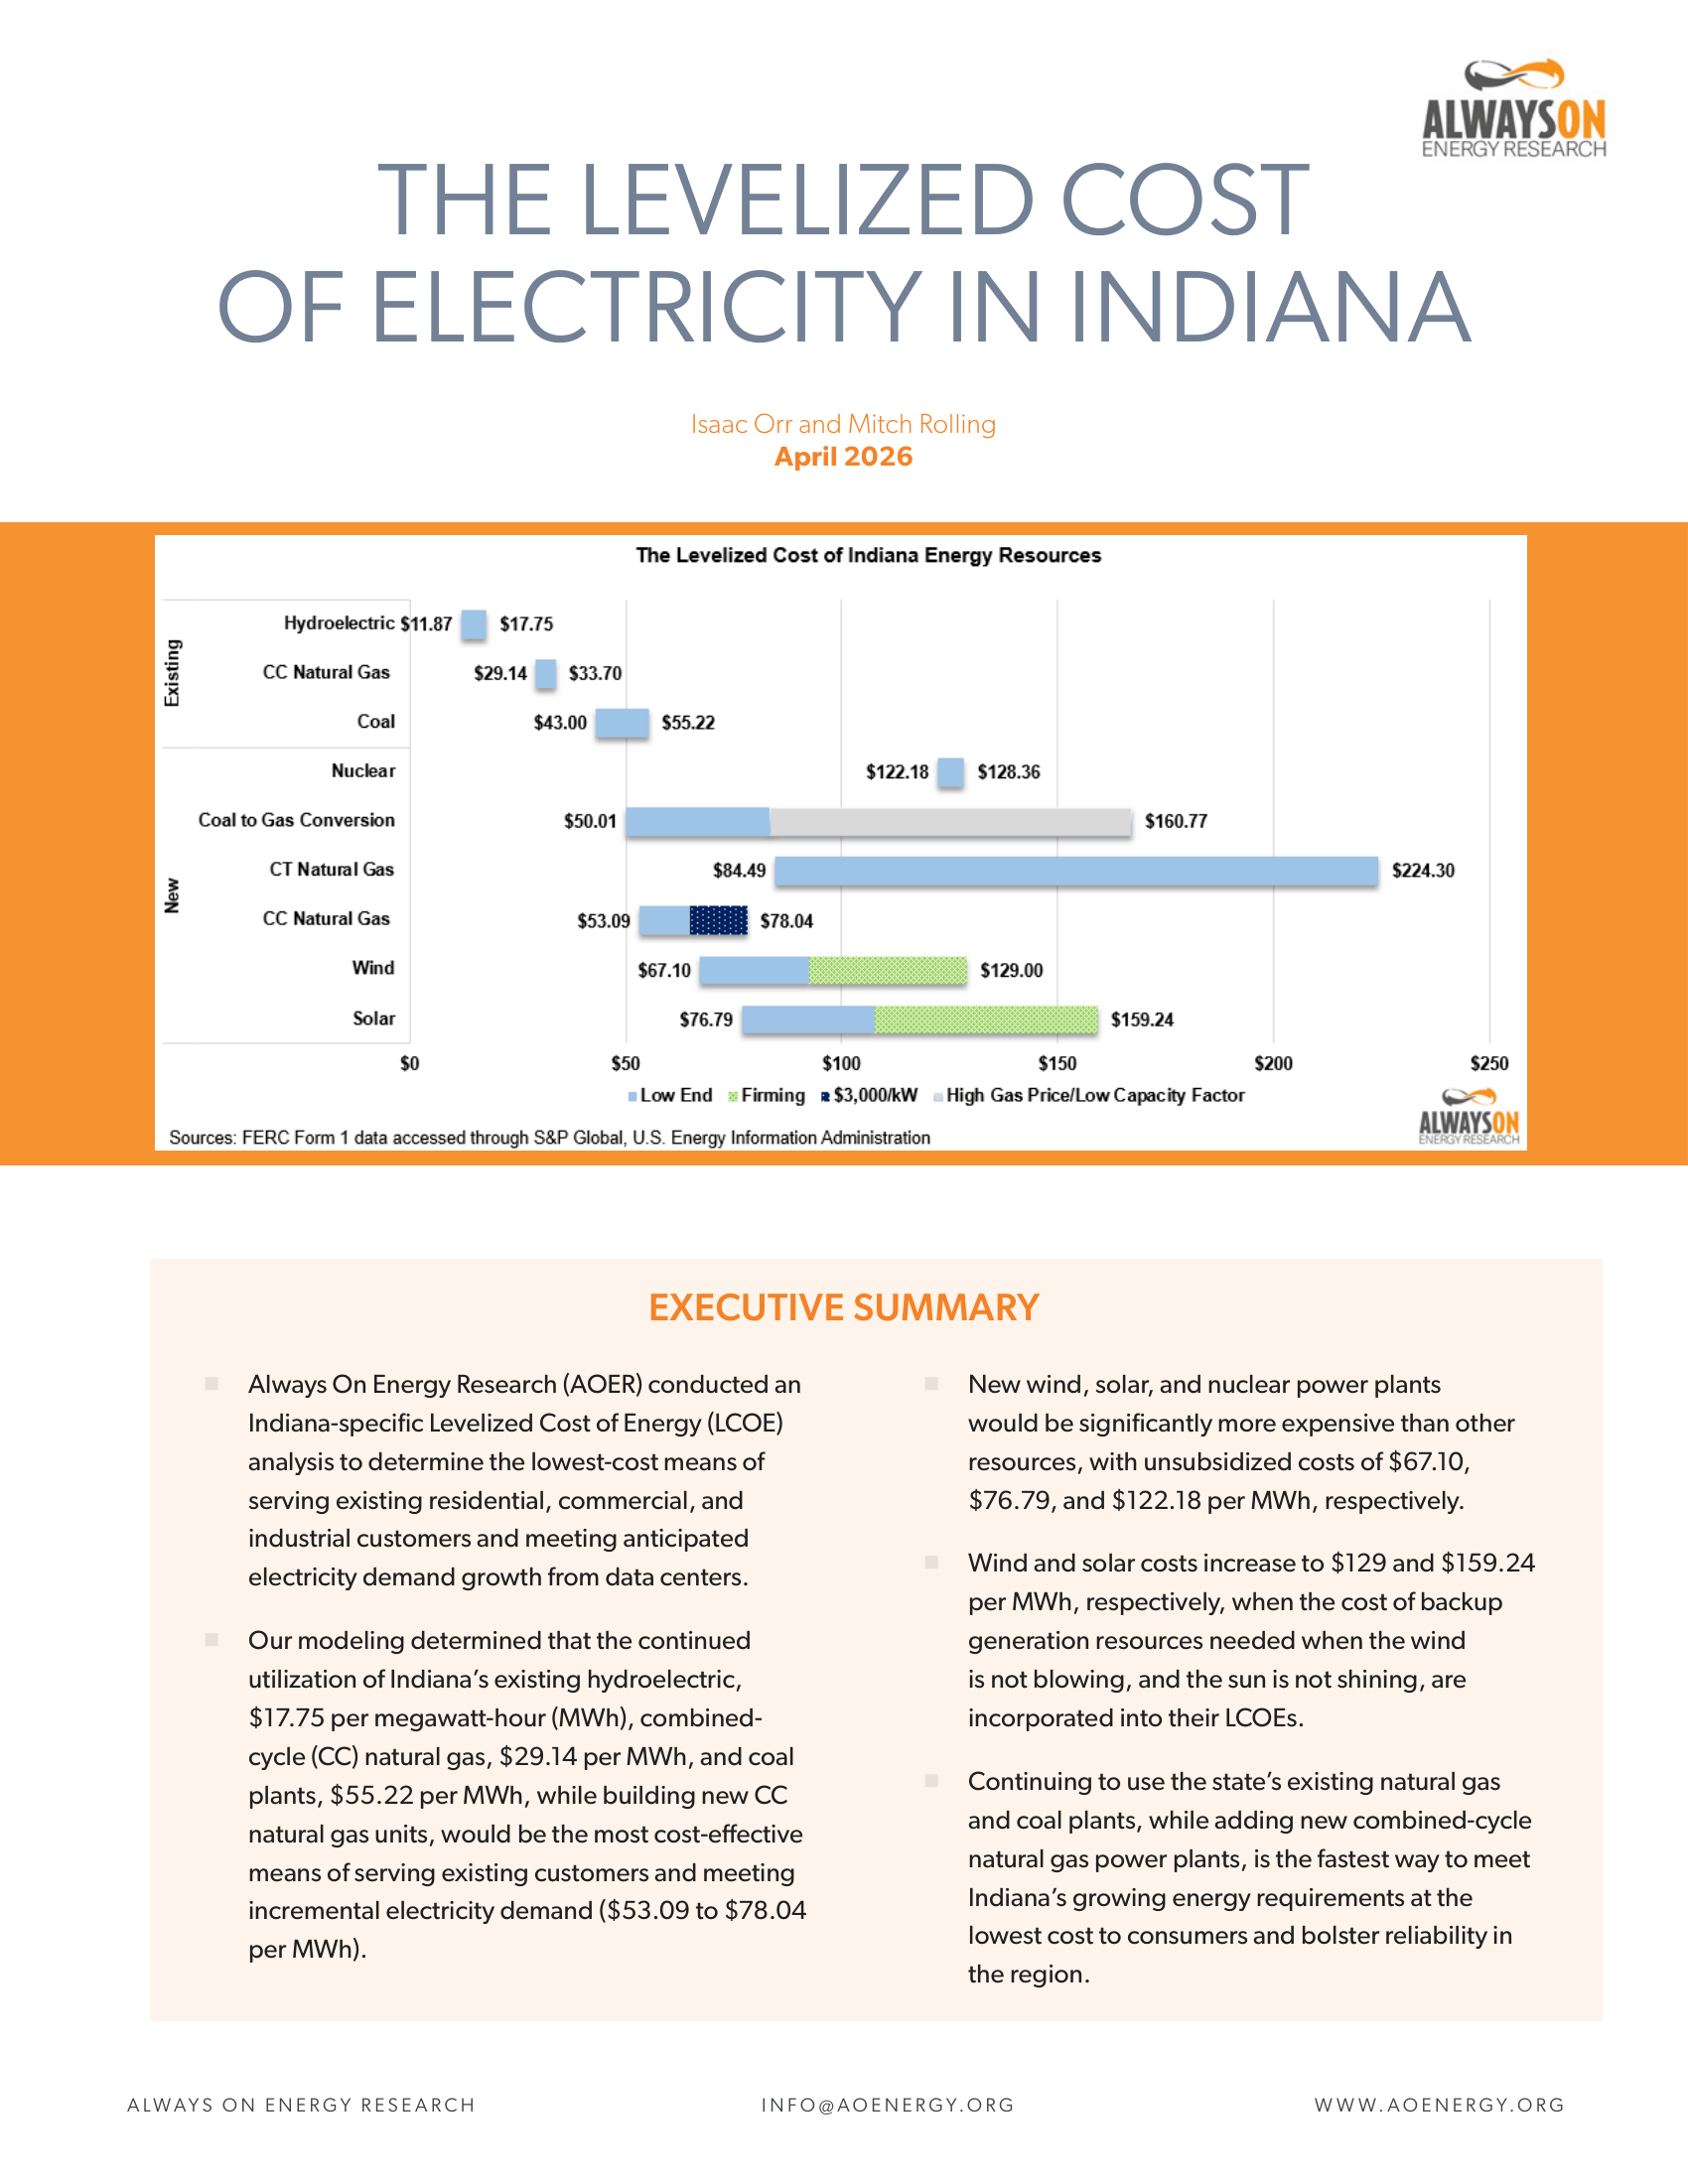
Traditional levelized cost of electricity (LCOE) numbers ignore what intermittent resources actually cost the grid. Always On’s Indiana-specific LCOE analysis, commissioned by Reliable Energy, Inc., sets the record straight by incorporating imposed costs and firming costs.
Indiana’s existing fleet remains the lowest-cost foundation for ratepayers: hydro at $17.75/MWh, combined-cycle natural gas at $29.14/MWh, and coal at $55.22/MWh. For new generation to meet surging data center demand, combined-cycle natural gas is the most competitive option at $53.09 to $78.04/MWh. Once you account for backup generation and the costs wind and solar impose on existing plants:
- Wind rises from $67.10 to $129/MWh.
- Solar rises from $76.79 to $159.24/MWh, even more expensive than new nuclear.
Seventy-five percent of Indiana’s existing coal fleet already produces power below the cost of the cheapest new-build option. With electricity prices up 93 percent since 2007 and over 12,000 MW of data center demand in the pipeline, Indiana can’t afford to get this wrong. The lowest-cost, most reliable path forward is maintaining the existing fleet and building new combined-cycle natural gas for growth.
Check out Always On’s full report on the Levelized Cost of Electricity in Indiana.
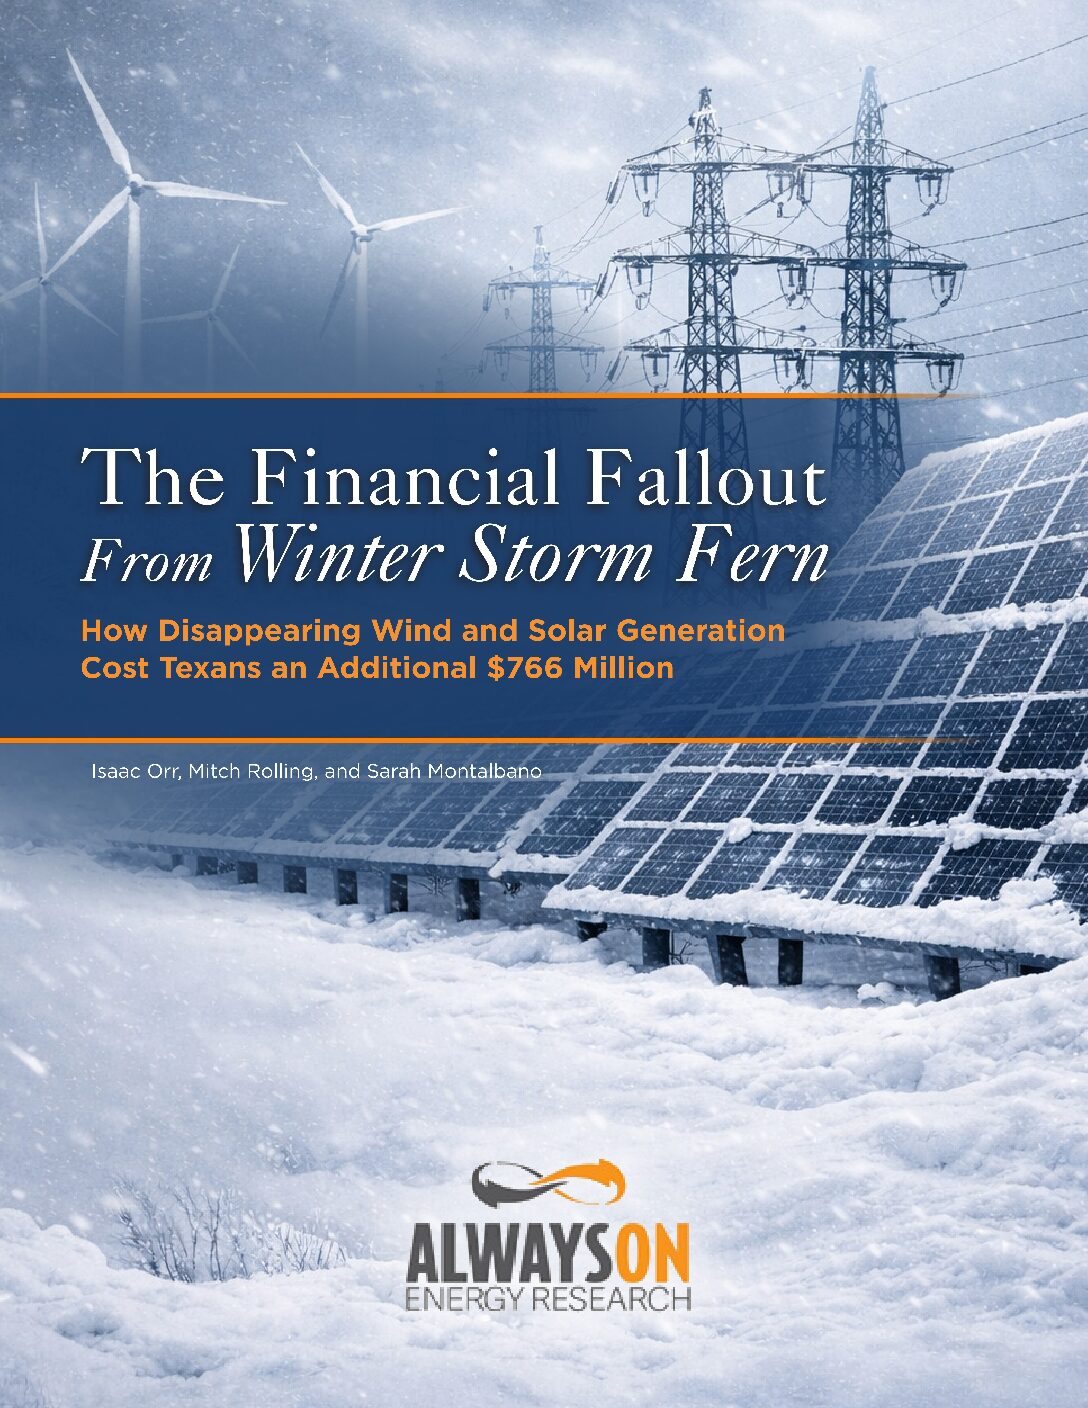
Disappearing wind and solar cost Texans an additional $766 million in just 17 hours during Winter Storm Fern. The Electric Reliability Council of Texas (ERCOT) Region has increasingly relied on weather-dependent resources, with no net dispatchable capacity added to the grid since 2003.
Relying on wind and solar has consequences. During Fern, as electricity production from wind and solar declined, wholesale prices spiked as high as $1,832/MWh in the day-ahead market, costing Texans an additional $766 million compared with baseline power costs. If ERCOT had 10 GW more natural gas on the grid during Fern, Always On’s analysis shows that Texas families and businesses would have saved $1.34 billion in wholesale power costs.
Check out Always On’s full issue brief about the financial fallout from Winter Storm Fern.

Colorado is flirting with an energy policy that has failed affordability everywhere it’s been tried. The idea is coming from U.S. Senator and gubernatorial candidate Michael Bennet. Facing a tough primary against Attorney General Phil Weiser, Bennet appears to be courting the Democratic Party’s environmental base by floating the idea of a Colorado cap-and-trade scheme. An idea that even current Governor Jared Polis has resisted, “saying that ‘it is not an appropriate policy for Colorado,’” reports Always On’s Sarah Montalbano in an Independence Institute post.
Under a Governor Bennet administration, the state would set an artificial cap on emissions, force suppliers to purchase allowances, and then pretend the resulting price increases are an unintended consequence, when in fact, they are a feature of cap and trade.
We’ve seen this Hollywood movie before. California’s cap-and-trade program contributes to some of the highest gasoline prices in the country. Washington state implemented a similar system and saw fuel prices rise quickly. New Mexico has adopted California’s low-carbon fuel standards, which our modeling shows will increase gasoline prices by 45 cents per gallon. In each case, working families, commuters, and small businesses pay the price.
Right now, Colorado enjoys competitive gas prices. That advantage will vanish under a Bennet cap-and-trade regime. Higher fuel costs will ripple through the economy, raising prices for everything from groceries to construction to freight and electricity generation.
Colorado is already layering aggressive decarbonization mandates onto its power sector. Adding cap-and-trade would further compound the state’s affordability crisis and continue to weaken the state’s economic competitiveness at a time when reliability and cost discipline should be the priority.
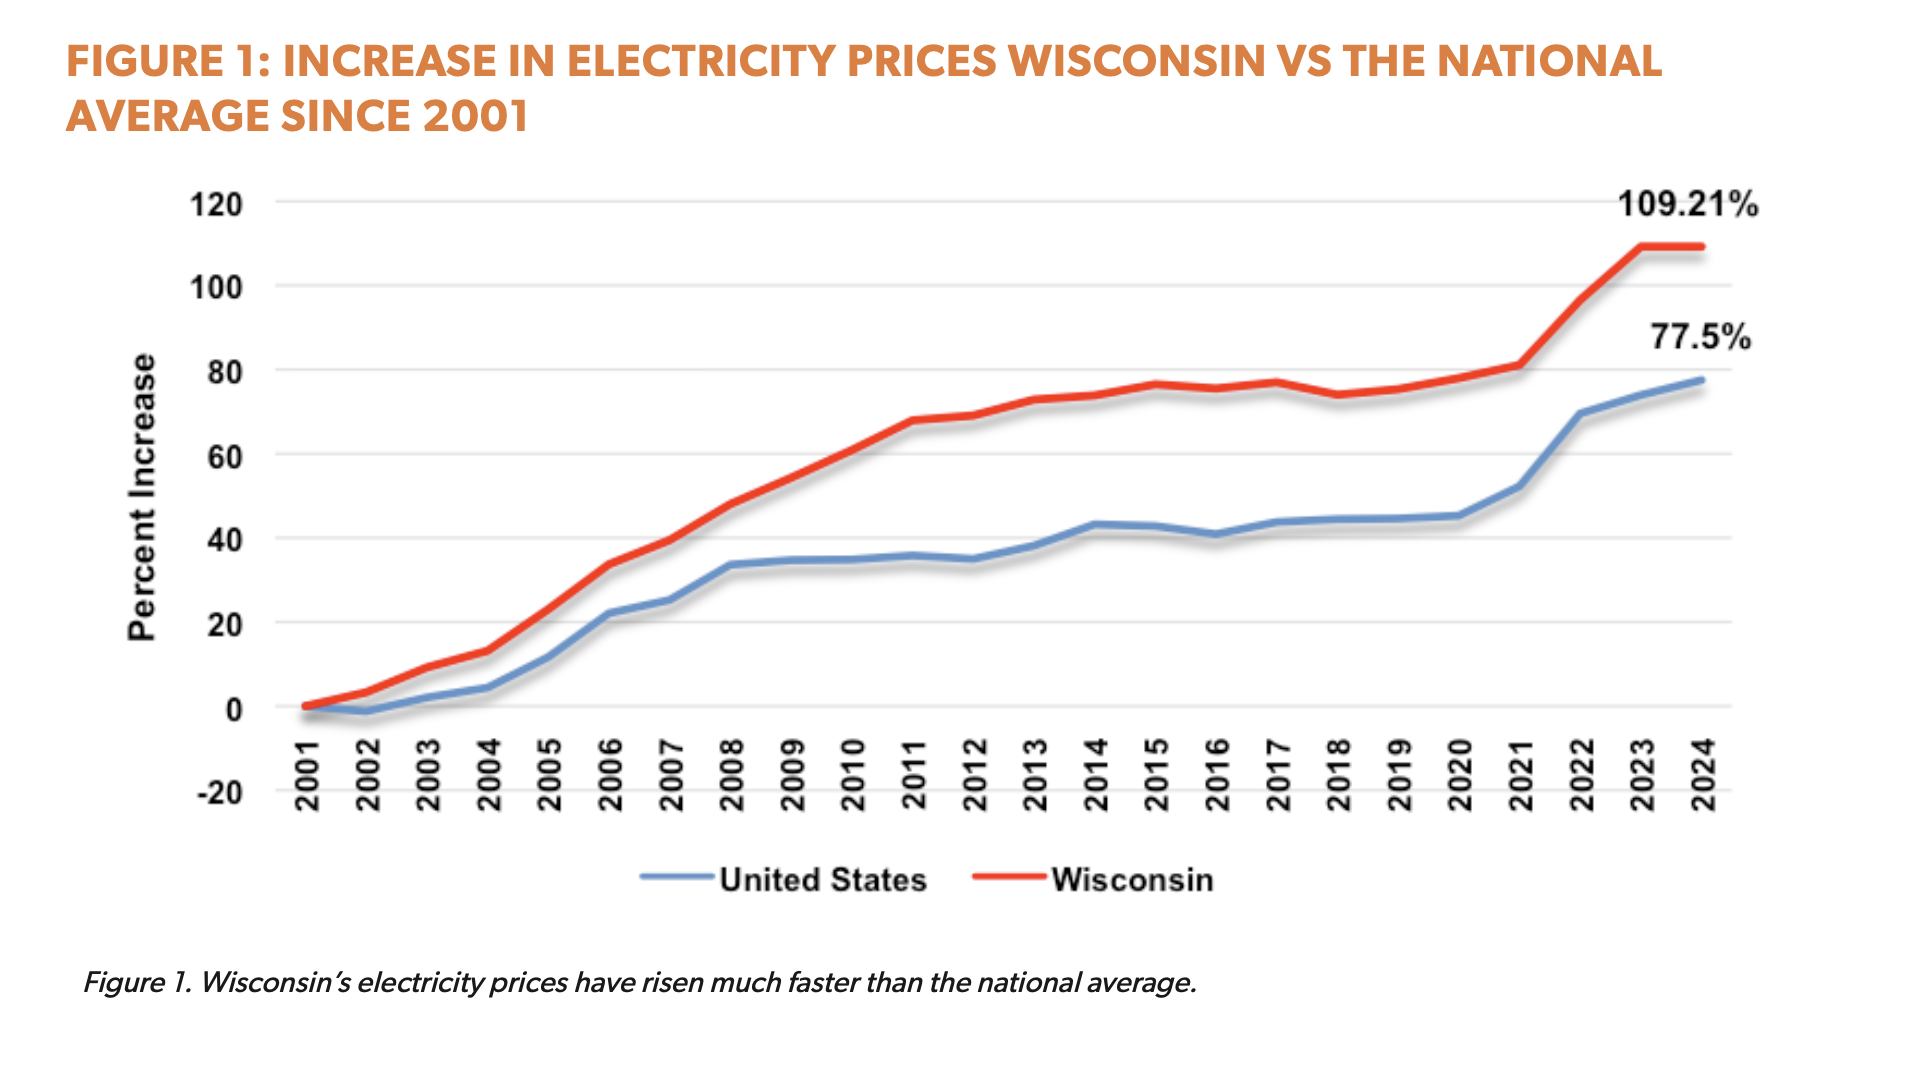
This is a business killer: “Wisconsin’s electricity prices are…regionally uncompetitive.” Since 2001, Wisconsin’s rate increases have significantly outpaced national rate increases. Part of the problem is that Wisconsin utilities are forcing their ratepayers to pay over $1 billion for coal assets they can’t use to generate power. While those coal plants sit idle, Wisconsin ratepayers will have to pay over $28 billion for new natural gas, wind, solar, and batteries. The result is that Wisconsin residents are staring down an electricity affordability crisis in the making.
Check out Always On’s issue brief on Wisconsin’s looming affordability crisis.
The latest from Always On’s Isaac Orr and Mitch Rolling, aka The Energy Bad Boys:
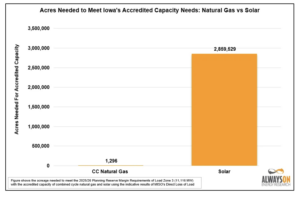
Utility scale solar is a land hog. Isaac and Mitch show that solar power’s land requirements are far more severe when taken through the lens of capacity value rather than simple energy production. This is important:
Most public discussions about solar focus on energy production, but power systems are built around reliability during peak demand. Once you look at the grid through the lens of accredited capacity—that is, capacity that can be relied upon during peak demand—instead of annual energy, the land requirements for different technologies look radically different.
This is the energy vs. capacity distinction that most solar land-use debates miss.
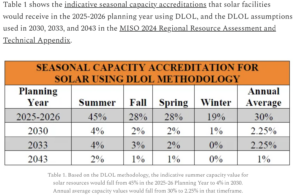
Using MISO’s new Direct Loss of Load (DLOL) accreditation methodology, the Boys demonstrate that solar’s capacity value will plummet from 30% in 2025-2026 to a mere 2.25% by 2030. At the same time, natural gas maintains an 82% capacity value.
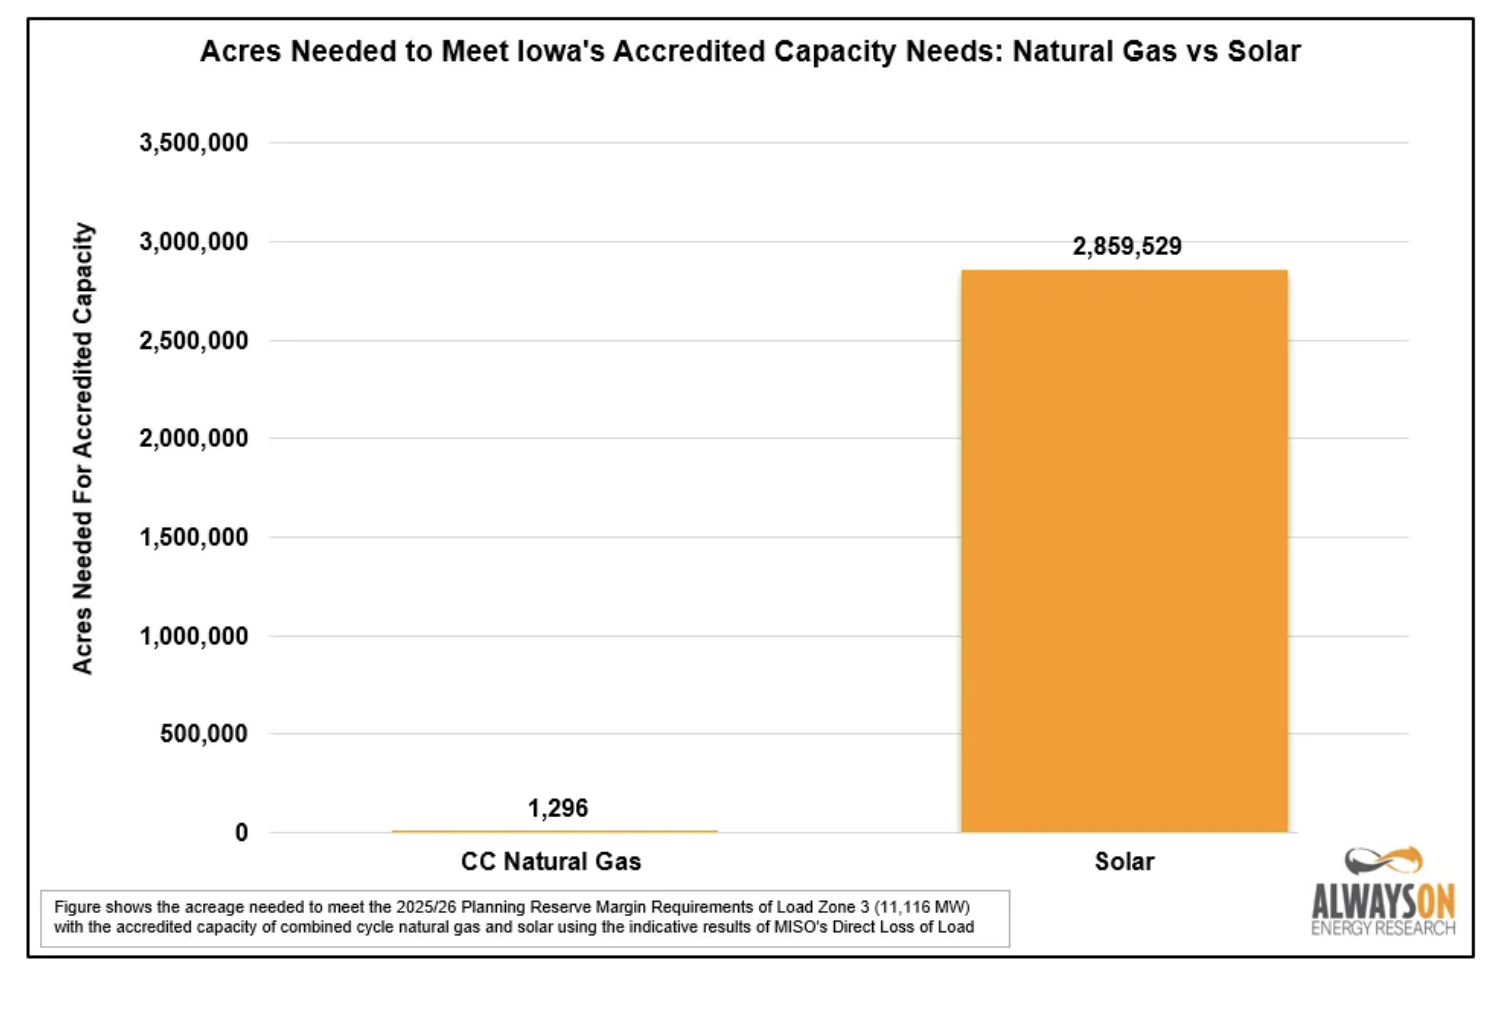
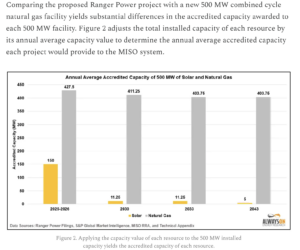
This means that matching the accredited capacity of a single 500 MW natural gas plant on 58 acres would require over 105,000 acres of solar panels in 2030. That’s roughly 29% of all land in Cerro Gordo County, Iowa. Meeting Iowa’s peak capacity needs with solar would gobble up 8% of the state’s total landmass, 2,207 times more land than an equivalent natural gas buildout.
There’s a real project—the River City Energy Project—that Always On analyzed. The proposed 500 MW solar facility from Ranger Power in Cerro Gordo County, Iowa, would consume 2,894 acres of mostly farmland. At the request of Cerro Gordo County, we provided expert witness testimony in the utility docket. Cerro Gordo County is home to picturesque Clear Lake, in north central Iowa.
Our testimony highlighted how MISO’s shift from ELCC (Effective Load Carrying Capacity) to DLOL appropriately reduces solar’s value as a reliability resource. This change will have critical implications for utility planning and land use decisions across MISO’s territory. And we have the charts and data to prove it.
Claims that wind and solar are the cheapest path to decarbonization rely on the flawed LCOE and exclude reliability costs. That’s why Always On created the Always On LCOE. When the Always On team accounts for the total system costs (Always On LCOE) of wind and solar energy, including backup generation, storage, transmission, and overbuilding required to meet peak demand, the economics change dramatically.
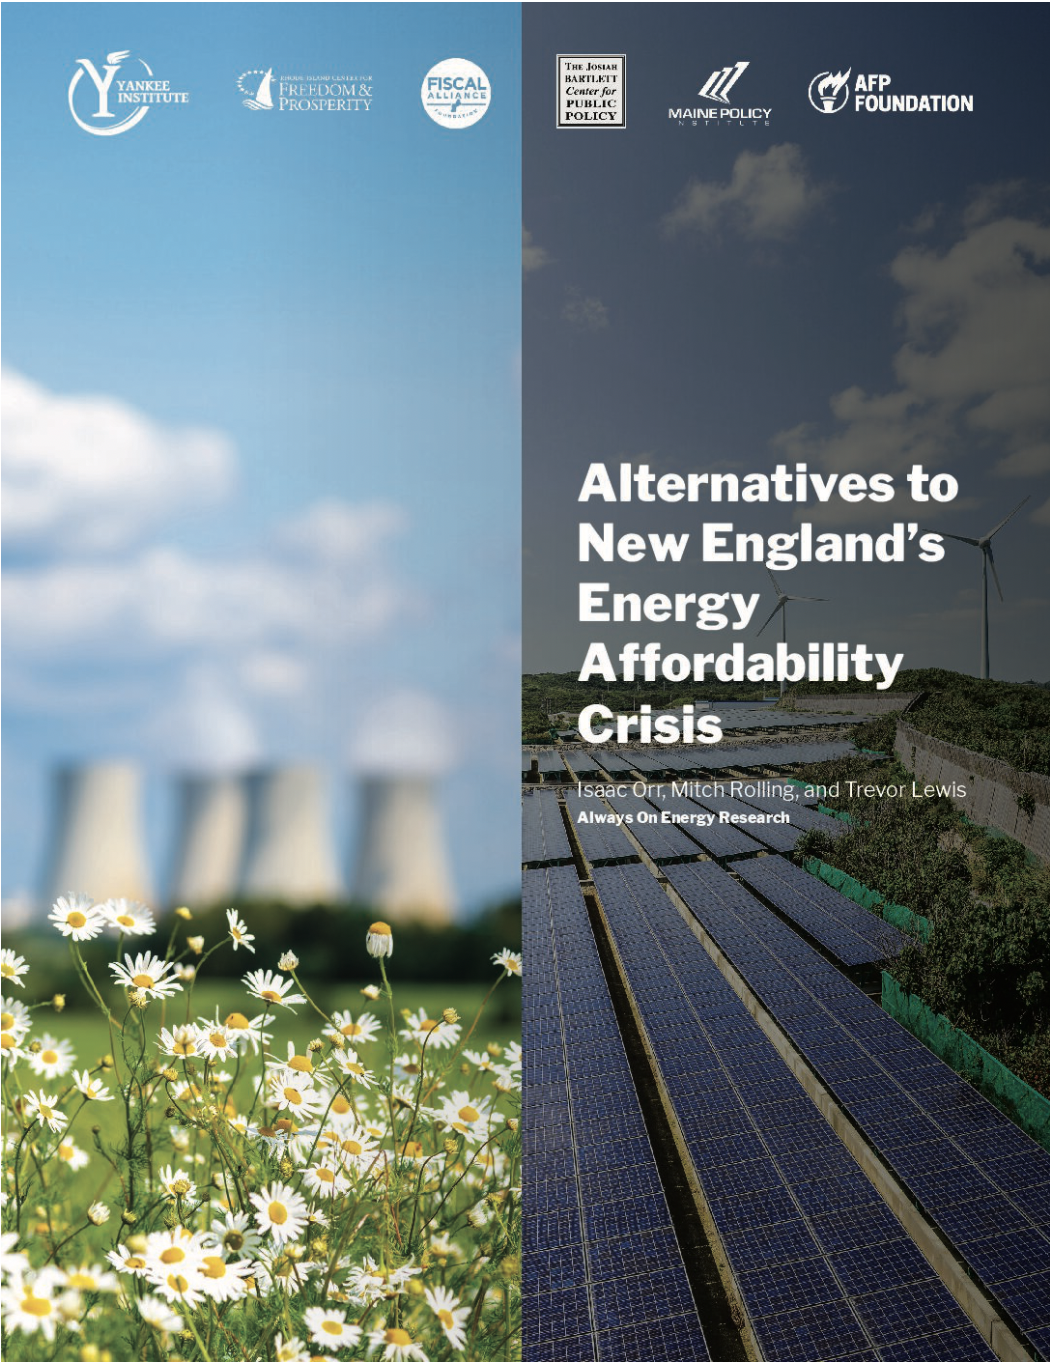
Our latest report on New England’s power system illustrates this point. Net Zero policies that prioritize wind and solar are more fragile and more expensive than policies that rely on nuclear and natural gas. Here’s what we found in Alternatives to New England’s Energy Affordability Crisis:
- When Always On models the Always On LCOE of New England’s decarbonization policies, “cheap” wind and solar soar to $815 billion through 2050.
- Alternatives provide massive savings
- A nuclear-only pathway would cost roughly $415 billion, cutting emissions by over 90 percent.
- A nuclear-plus-natural gas portfolio would save more than $600 billion and provide a 50 percent reduction in GHG emissions.
- Alternatives avoid blackouts that wind and solar cannot.
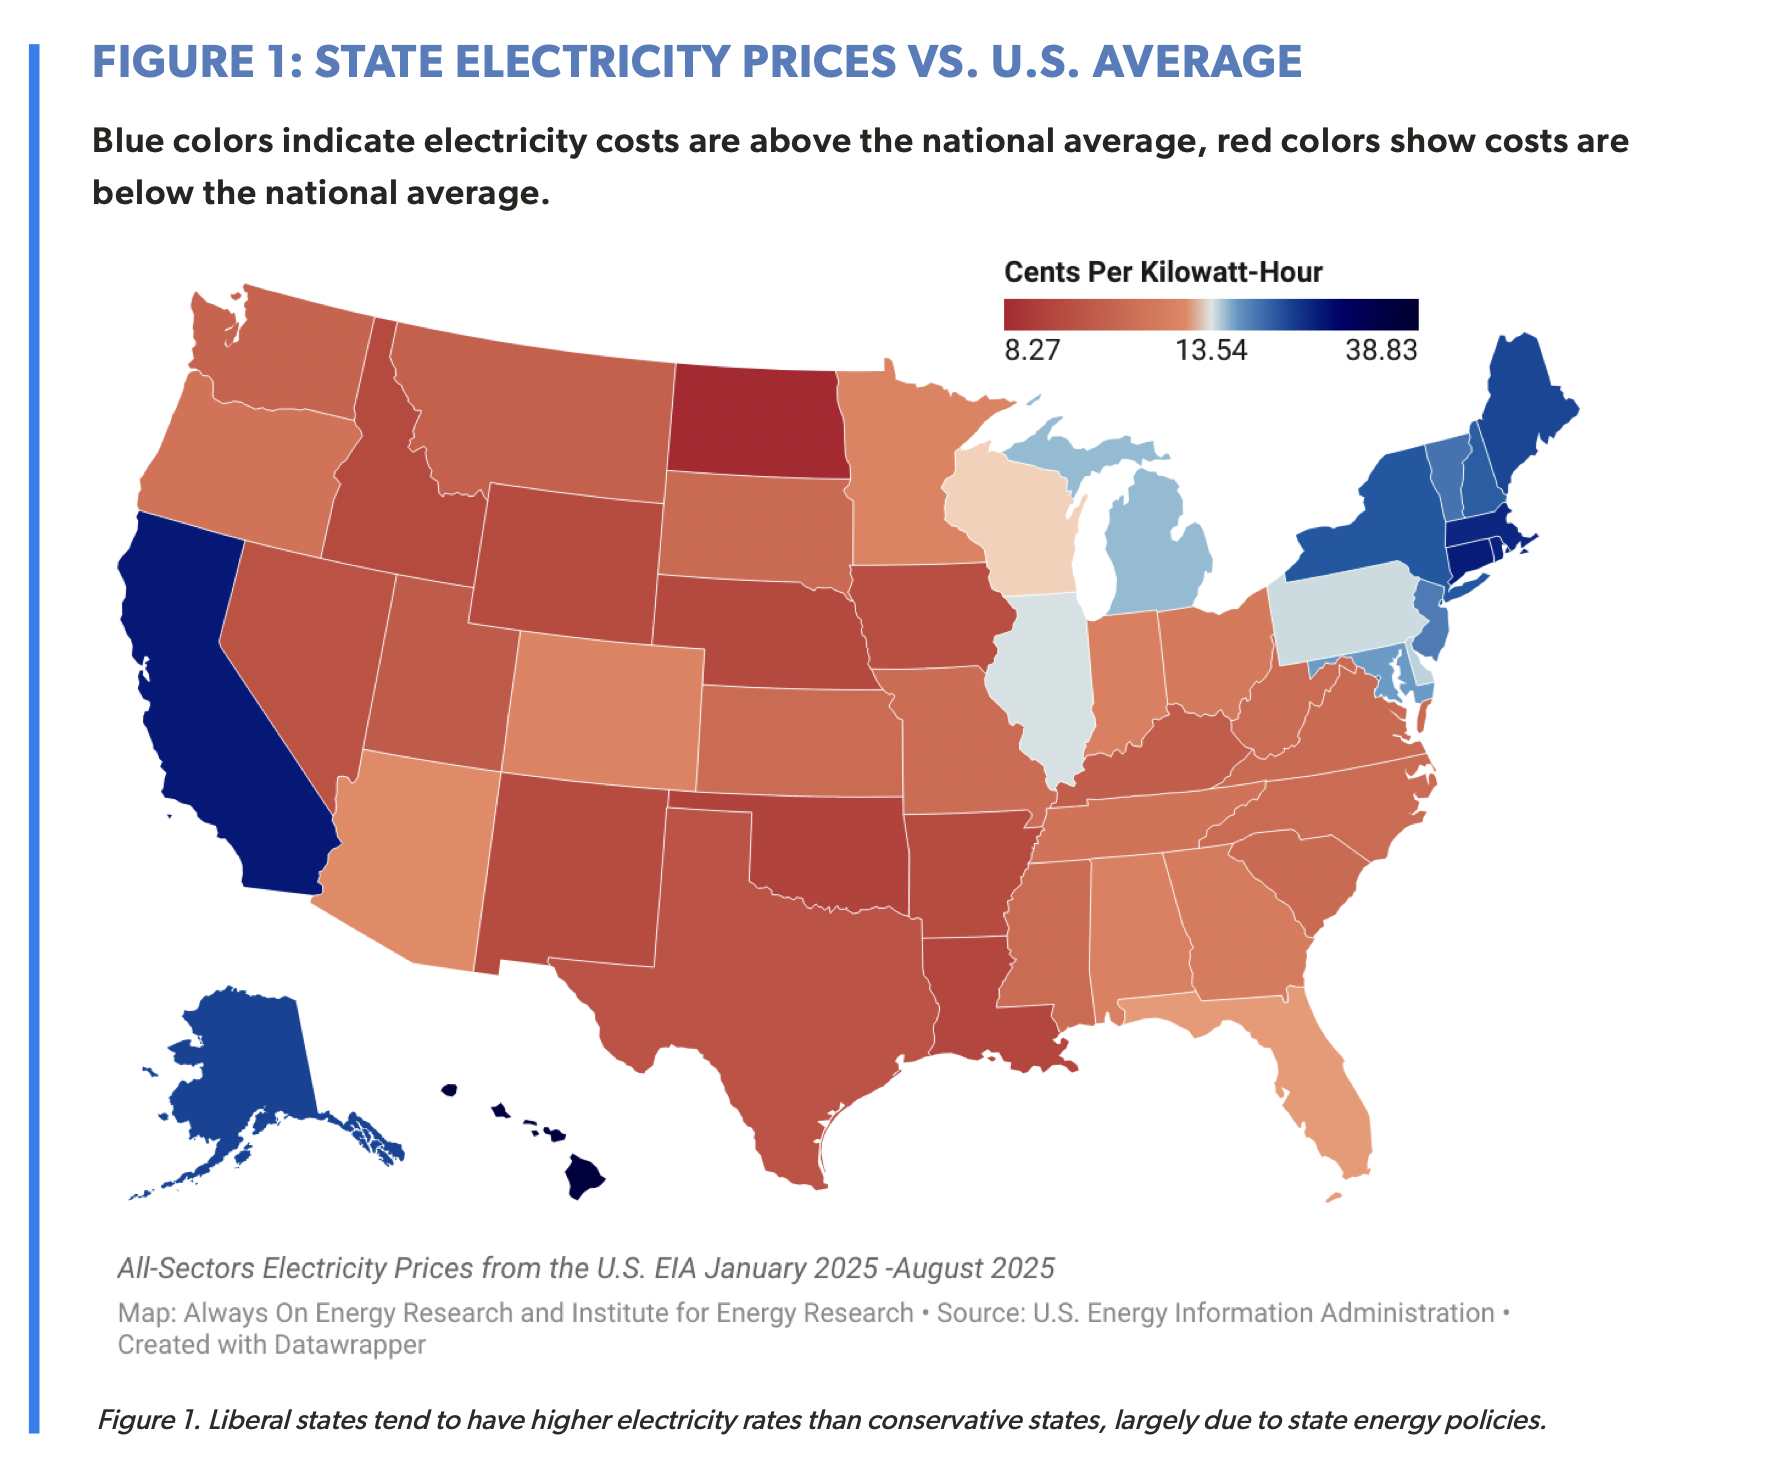
Electricity affordability is not an accident of geography or markets. It’s a function of deliberate state policy choices that influence generation portfolios, infrastructure decisions, and regulatory mandates.
Our Blue States, High Rates study, co-authored with the Institute for Energy Research (IER), shows how state-level energy policy choices drive electricity prices across the United States. Our research finds that 86 percent of states with electricity prices above the national average are reliably Democratic (“blue”) states. In comparison, 80 percent of the states with the lowest electricity prices are reliably Republican (“red”).
Higher costs in blue states are linked to aggressive renewable and carbon-free mandates, clean energy standards, net-metering policies, premature retirements of dispatchable generation, and restrictions on natural gas infrastructure. All of these increase costs for households and businesses. By contrast, many red states prioritize affordable, dispatchable generation and avoid costly mandates, resulting in lower average electricity rates for consumers. The study highlights California, New York, Florida, Louisiana, and Kentucky as exemplars of how contrasting policy frameworks affect affordability and reliability.
We advanced the Blue States, High Rates theme in two opinion editorials.
- Mitch and Isaac pose this question to The Hill readers: “If Democrat policies make energy affordable, why are they backtracking from them?” Blue States, High Rates explains why.
- Isaac and co-author Tom Pyle from IER write in Real Clear Energy that high electricity prices are a choice that blue states make every day.
National Review cited our work in an article highlighting the left’s “hypocrisy problem with energy and affordability,” noting that the left’s rhetoric about lowering costs contrasts with observed price outcomes in states with aggressive clean energy mandates
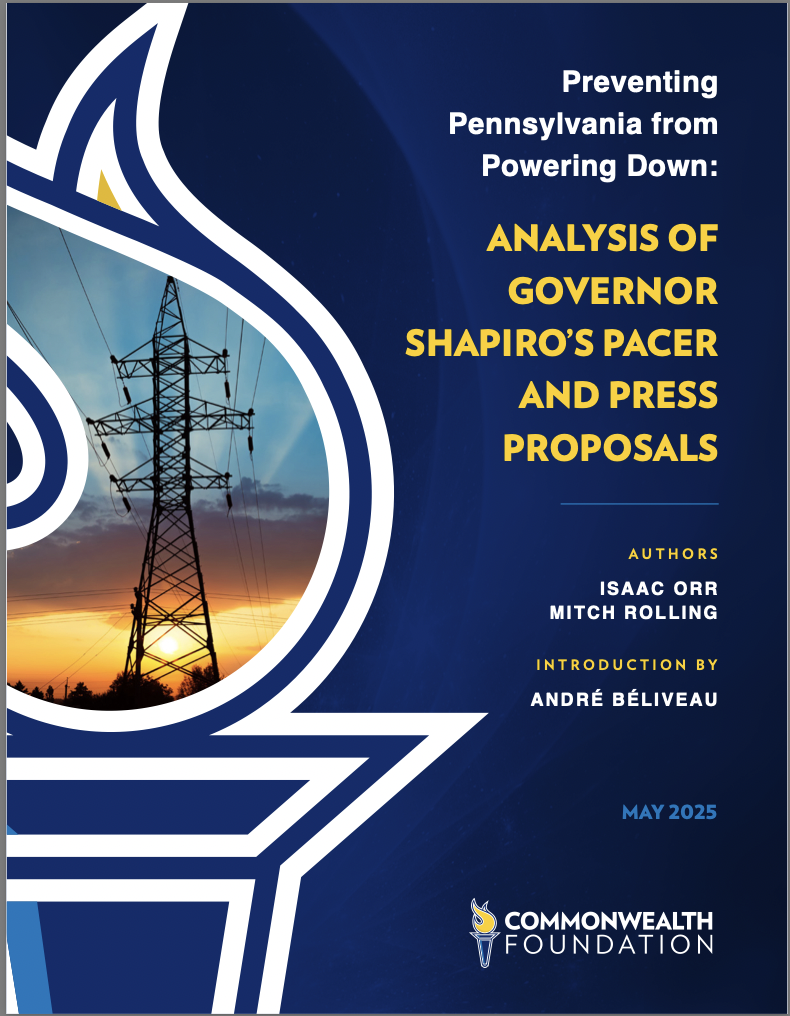
Always On co-founders Isaac Orr and Mitch Rolling authored a report, Preventing Pennsylvania from Powering Down: An Analysis of Governor Shapiro’s PACER and PRESS Proposals, commissioned by the Commonwealth Foundation. The study examines the projected cost and reliability impacts of Democrat Governor Josh Shapiro’s two signature climate initiatives: the Pennsylvania Climate Emissions Reduction Act (PACER) and the Pennsylvania Reliable Energy Sustainability Standard (PRESS).
Despite campaigning on a healthy skepticism of the Regional Greenhouse Gas Initiative (RGGI), a multistate cap-and-trade carbon tax, Shapiro introduced PACER to establish a state-specific version of RGGI. It would set strict carbon emissions limits for thermal power plants and charge a fee for each ton of emissions. At the same time, PRESS would greatly expand Pennsylvania’s portfolio of alternative, intermittent energy generation.
Together, PACER and PRESS would significantly raise electricity costs while increasing the grid’s reliance on unreliable, weather-dependent resources. Always On’s proprietary modeling shows that if enacted, PACER and PRESS would add $157 billion in electricity costs by 2035, pushing average rates 60 percent higher, from 12.6 cents per kWh to 20.2 cents per kWh. Household bills would more than double, increasing $1,754 annually, while commercial and industrial consumers would face even steeper cost hikes.
The consequences would extend far beyond Pennsylvania. As the third-largest electricity producer in the nation and its largest exporter, Pennsylvania currently supplies about 35 percent of the power it generates to other states. Its diverse fleet of natural gas, nuclear, and coal plants plays an indispensable role in maintaining reliability across the Eastern Interconnection. Weakening that fleet through policies like PACER, PRESS, and RGGI would ripple across regional grids—raising costs, reducing reliability, and undermining one of America’s most important states for affordable, dependable energy.