
Affordability and rising electricity demand for data centers are top of mind for the energy industry. As prices have risen, prominent members of the wind and solar advocacy camp, like Jigar Shah, Tyler Norris, and others, claim that prices are rising not because of the massive national malinvestment in wind and solar resources, but because we are not fully using the grid we already have.
But this argument ignores that their preferred resource plans require adding gigawatts of intermittent wind and solar resources, along with the transmission lines to connect them, which has significantly reduced the overall utilization rate of the generation resources already serving the grid.
This reality is hidden by the fact that these arguments frequently use load factor, rather than fleet-wide capacity factor, as a measure of utilization. Framing the problem this way makes peak demand the villain, rather than low-utilization resources like wind and solar that operate at low capacity factors because they depend on favorable weather. Load factor is a useful and legitimate metric to use in certain circumstances, but it does not illuminate the complete picture behind low grid utilization, nor does it highlight a growing problem—that the enormous amounts of wind and solar capacity built in recent years spend much of the time producing little to no electricity by design.
Today, we examine the current arguments for increasing grid utilization and show how the proposed wind and solar generation fleets of advocates like Shah, Norris, and Jesse Jenkins at Princeton’s Net Zero America project would actually cause the utilization rate to plummet even further.
In short, you can have a grid with a higher utilization rate, or one that incorporates large penetrations of wind, solar, and battery storage capacity. You can’t have both.
The Grid Utilization Argument
Tyler Norris rose to prominence in energy circles after authoring a February 2025 report at the Nicholas Institute for Energy, Environment & Sustainability at Duke University. Norris’s research found that nearly 100 GW of large new loads could be integrated with minimal impact if large electricity users temporarily reduce consumption during periods of grid stress by shifting workloads, utilizing on-site generation, or adjusting operations.
Likewise, in a recent Utility Dive op-ed, Jigar Shah makes the following arguments:
- “Utility rates are set through public processes, and today’s increases are driven by record spending plans, a wave of rate cases, and a grid planning model that rewards building more infrastructure, often to serve just a handful of congested hours.”
- “If states respond with peak-driven planning — building the grid to serve the hottest hour of the year plus a reserve margin — customers will pay for infrastructure that sits underutilized most of the time. In our analysis, the grid is only 50 percent used throughout the year. There’s a better way: Build smarter before you build bigger.”
- “The U.S. grid has a lot of unused capacity waiting to be unlocked. Today, we face rapid load growth and rising bills. If we treat every new megawatt like it must be served with new poles, wires, substations, and [natural gas] peakers, we will lock in another decade of rate shock.”
Despite the irony of simultaneously blaming rising electricity prices on record-breaking utility spending plans while also celebrating the fact that most new generation capacity is wind, solar, and storage, Shah’s basic arithmetic is correct: flexible demand can reduce costs for everyone by improving the load factor of the grid, which is calculated by dividing the average electricity demand on the grid by the peak load.

These arguments only work in a vacuum, however. They are correct if new capital is not being spent on the system, but not if more money is spent building intermittent infrastructure, which drives up utilities’ revenue requirements and increases the cost of serving demand.
Furthermore, wind and solar have limited ability to serve new demand because, as we have discussed in previous articles, these resources have exceedingly low capacity values compared to thermal units.
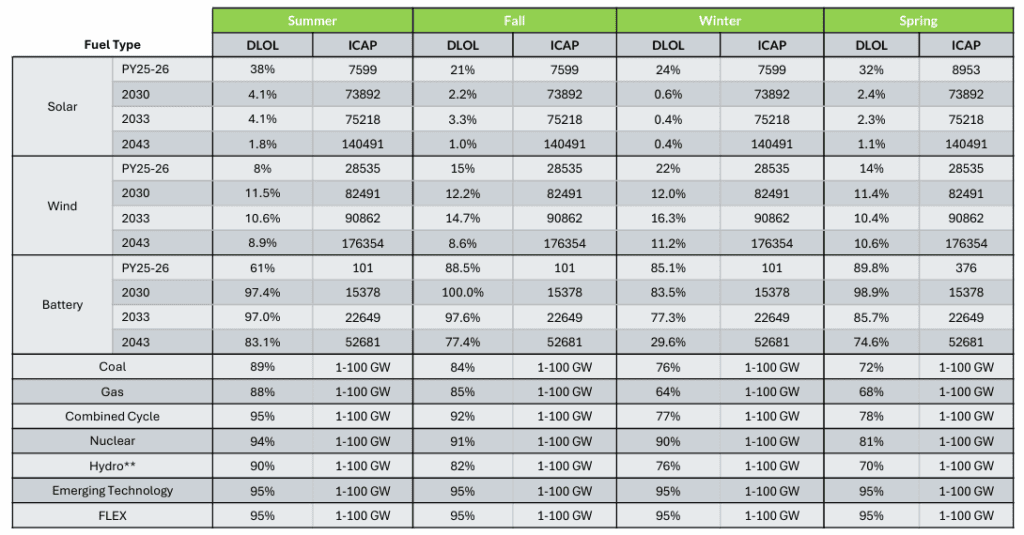
Additionally, the use of load factor in these arguments, which measures average load/maximum load instead of the system-wide capacity factor, ignores the fact that adding non-dispatchable wind and solar has already substantially reduced the system-wide capacity factor, defined as total electricity consumed/total nameplate capacity, on the U.S. power grid.
U.S. Grid Utilization is Falling
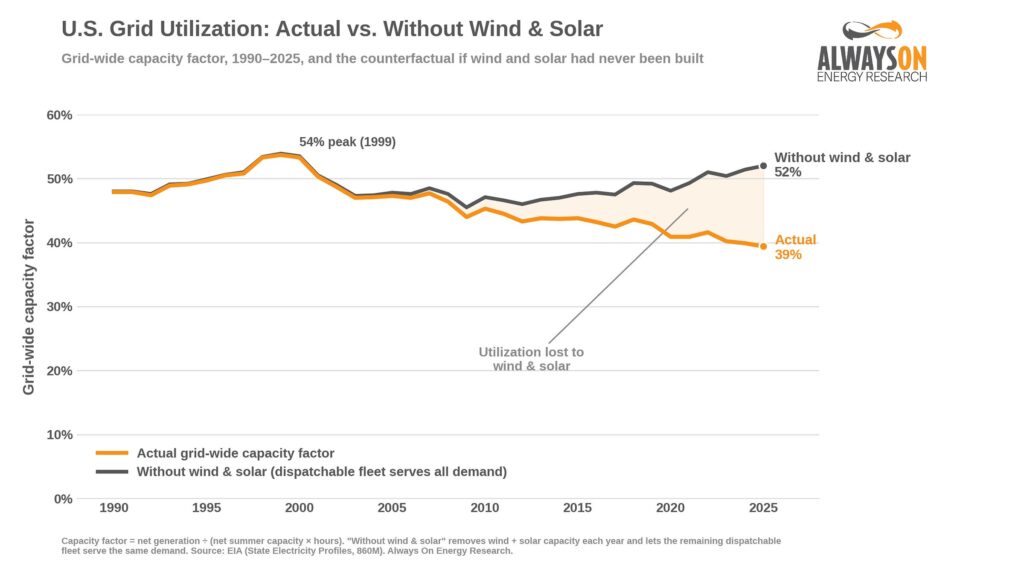
U.S. grid utilization—defined here as the average fleet-wide capacity factor of all of the installed generating capacity—has been falling for decades. After peaking in 1999 at 53.7 percent, it has since fallen to 39.4 percent as of 2025, as shown in the graph below.
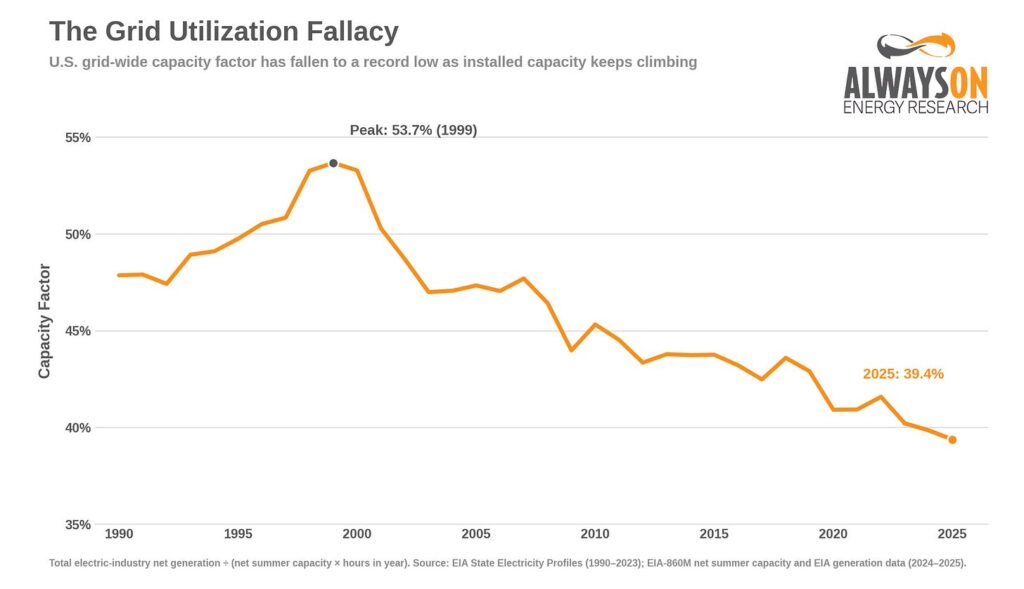
Plummeting grid utilization is the direct result of adding more generation resources to the grid over the past three decades without a corresponding increase in electricity production. The graph below shows the total installed capacity by resource type and overall electricity sales for the U.S.
As you can see, the installed capacity on the grid increased by 559,000 megawatts (MW), or 77 percent, while generation grew by only 46 percent since 1990, with much of this growth occurring between 1990 and 2007. Natural gas was the primary addition from the early 2000s through 2025. However, since 2010, much of this new gas has simply displaced existing coal, rather than increasing the total amount of thermal resources available to serve new load.
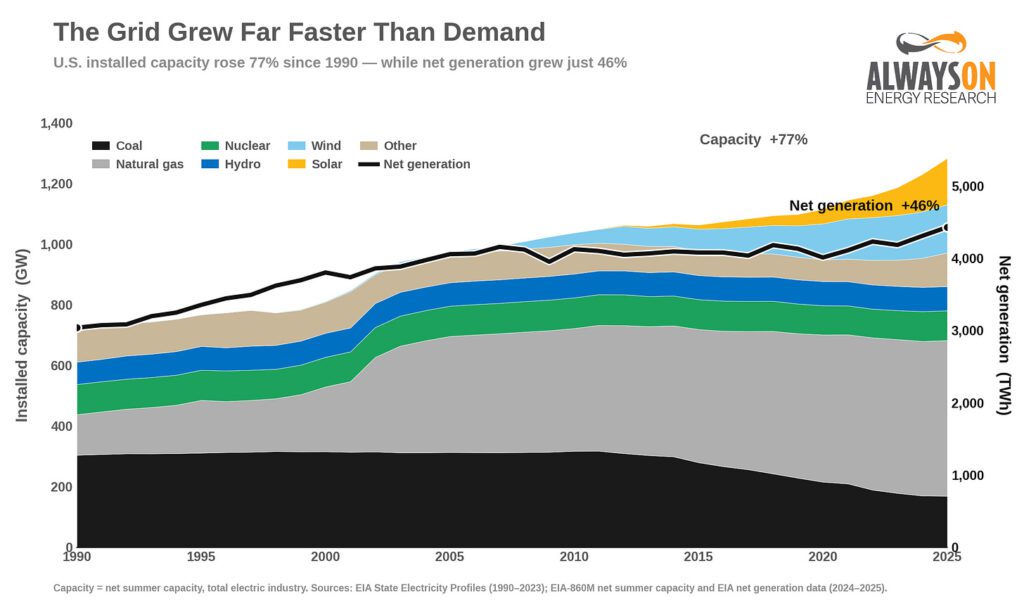
Demand essentially peaked in 2007 and remained flat until the recent increases observed since 2022. Installed wind and solar capacity has surged since 2007, and overall nameplate capacity has increased by 77 percent since 1990, despite a massive loss of coal-fired capacity that began declining around 2011.
This has likely contributed to higher prices, as shown below, because the cost of continued spending on new resources has been spread over the same or fewer MWhs of electricity sales. Costs have also likely risen because fully depreciated, inexpensive coal plants have been retired, and new payments are now being made for wind, solar, battery, and gas facilities.
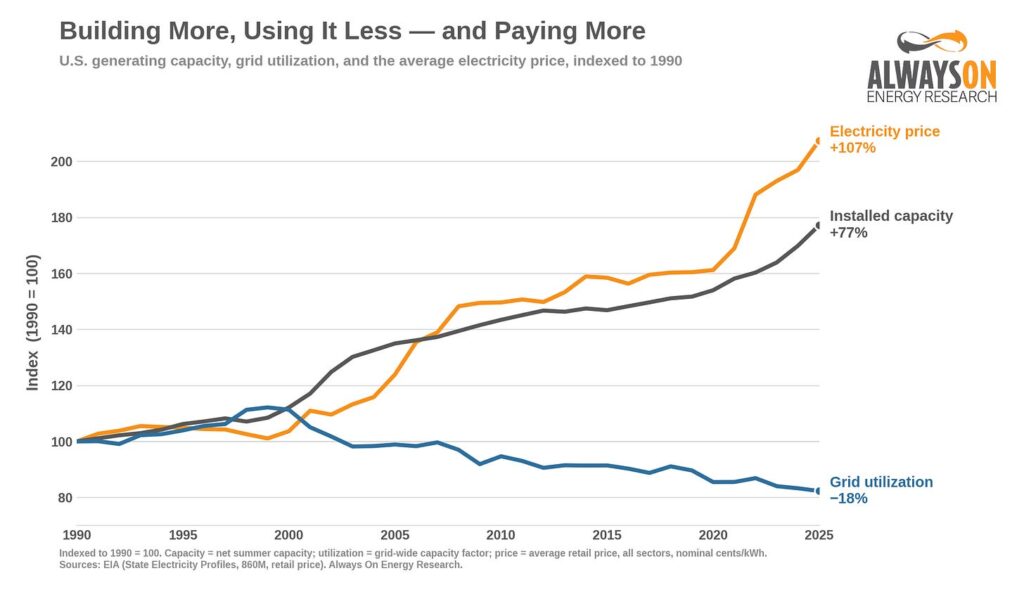
As you can see, falling grid utilization is not a bug of a grid with high penetrations of wind, solar, and battery storage resources, it is an entirely foreseeable feature. To demonstrate, we turn to the capacity and energy generation figures in the Net Zero America (NZA) study from Princeton University.
Grid Utilization Under Net Zero America
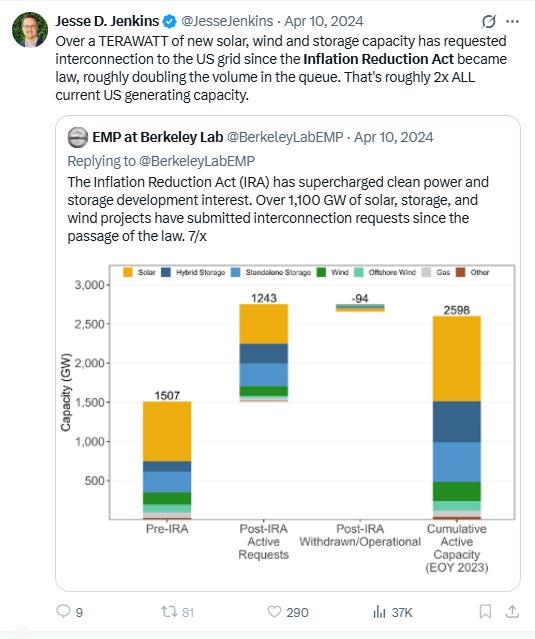
Before we dig in, it’s worth noting that the NZA study was coauthored by Jesse Jenkins, who was one of the biggest proponents of the Inflation Reduction Act (IRA) and the surge of proposed wind, solar, and battery capacity that resulted from it.
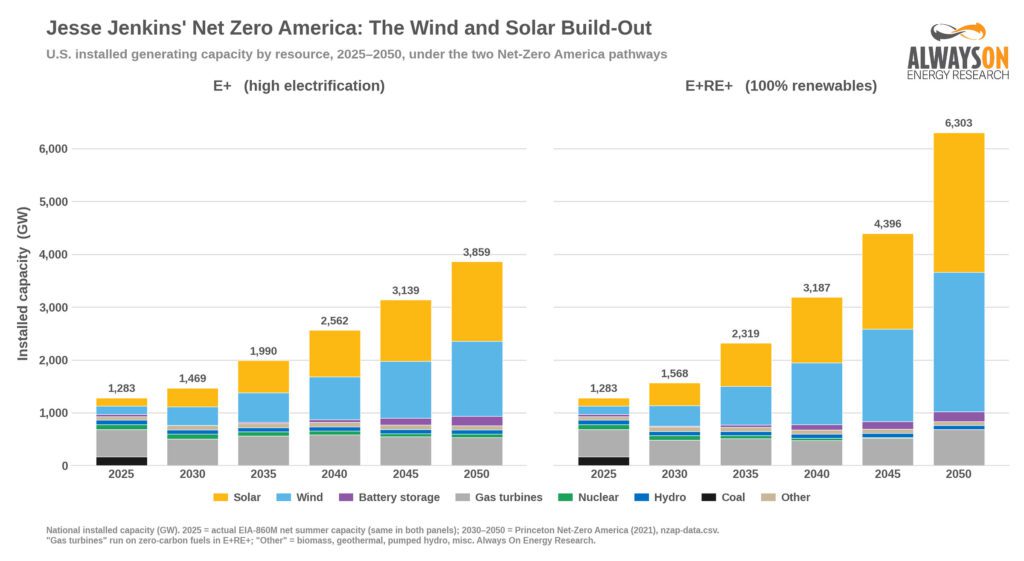
The NZA study “quantifies five distinct technological pathways, all using technologies known today, by which the United States could decarbonize its entire economy.” For our purposes, we examined the E+ High Electrification and E+RE+ (100 percent renewable) scenarios.
According to this very large spreadsheet, overall grid capacity would need to increase from 1,283 gigawatts (GW) of capacity to 3,859 GW by 2050 in the E+ High Electrification Scenario, and 6,303 GW in the 100 percent renewable scenario, meaning the grid would need to triple in the E+ Scenario and increase by a factor of five in the 100 percent Renewable Scenario.
However, even when counting the electricity used to make green hydrogen, total generation grows more slowly than capacity — rising to only about 2.2 times its 2025 level by 2050 in the E+ scenario and about 3.5 times in the 100 percent renewable scenario. This means these scenarios would substantially increase installed capacity in a high-penetration renewable energy grid without a commensurate increase in power consumption.
Importantly, the modeled NZA electricity generation growth figures include using excess electricity to generate “green hydrogen.” This assumption then increases the fleet-wide utilization rates in the graphs below to around 30 percent, but it does so by assuming a massive increase in a technology that is collapsing around the globe.
If we assume this green hydrogen production does not materialize, then generation only increases by about 93 percent in the E+ scenario and about 107 percent in the 100 percent renewable scenario, as shown in the graph below. Again, this is compared with a 3-5x increase in grid capacity.
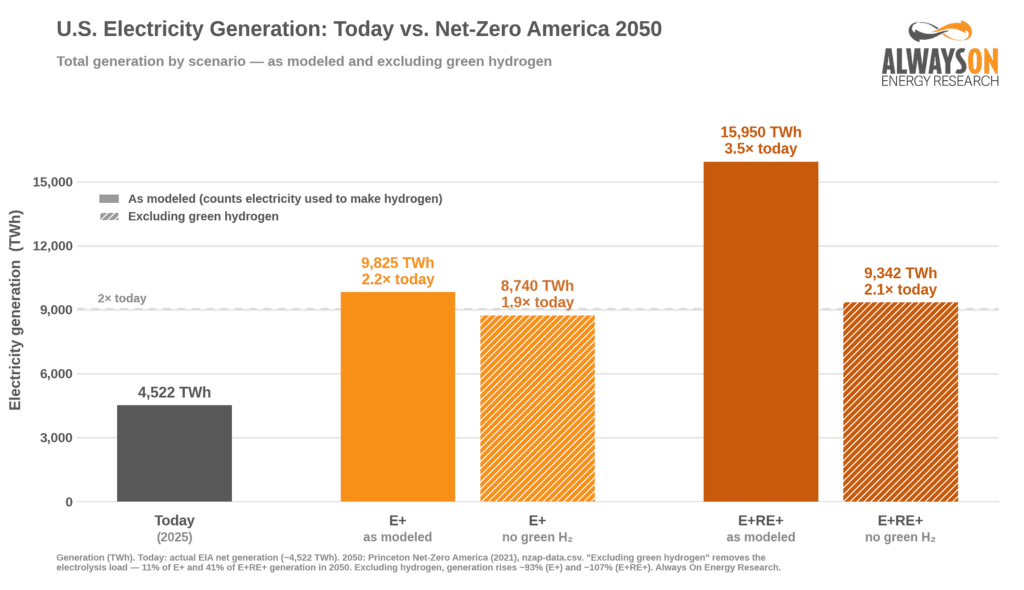
Increasing the total installed capacity on the grid faster than increasing the electricity consumed on it will necessarily decrease the utilization rate of the system.
The graph below shows the fleet-wide capacity factor in 1999, 2025, and what it would be in 2050 under the Princeton NZA scenarios. Grid utilization falls dramatically to below 30 percent in all scenarios, but in the 100 percent renewable without green hydrogen scenario, it drops to a mere 17 percent.
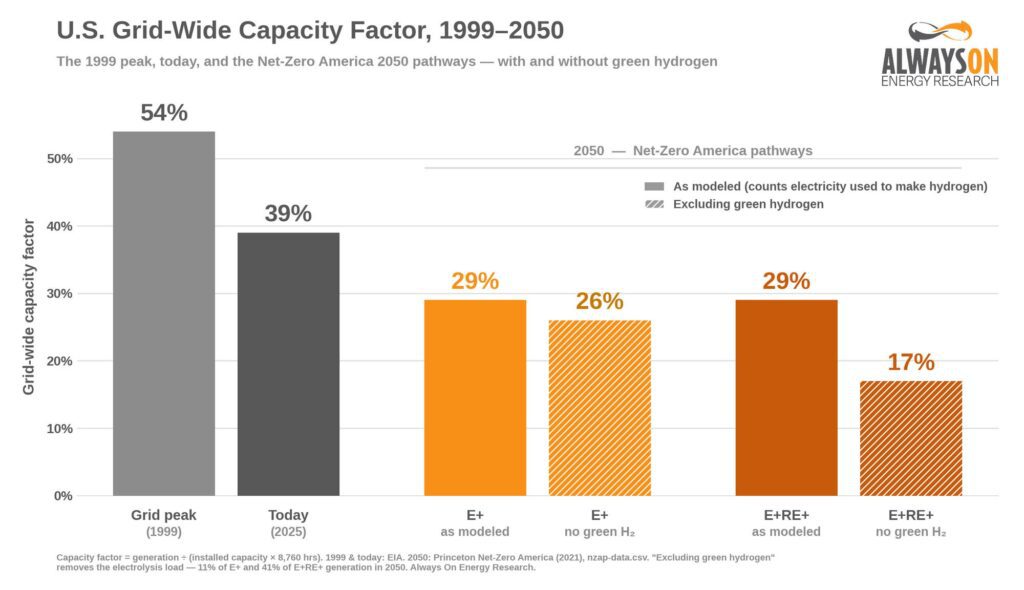
In contrast, if there were no wind and solar resources on the grid, the fleet-wide capacity factor would be 52 percent, near the peak achieved in 1999, rather than the 39 percent fleet-wide capacity factor observed in 2025. In other words, much of the 13-point utilization decline can be traced back to bolting low-capacity-factor resources onto the system.
Conclusion
Overall grid utilization is falling in the United States because we added approximately 312,000 MW of wind and solar resources during a two-decade period when demand was essentially flat.
Now that demand is surging, wind and solar advocates are using load factor as a red herring to hide the fact that they’ve spent billions of dollars expanding the generation fleet, driving down overall utilization rates. This additional spending has put upward pressure on prices, as the numerator of capital spending outpaced the denominator of MWhs sold.
This piece was originally published at the Energy Bad Boys Substack by Isaac Orr and Mitch Rolling on August 29, 2026.