by Isaac Orr and Mitch Rolling
We are currently working on an exciting new project called the Social Cost of Blackouts.
In this upcoming report, we argue that regulatory agencies like the Environmental Protection Agency (EPA) and utility regulators should be required to determine whether proposed power plant regulations or integrated resource plans (IRPs) will result in blackouts based on hourly reliability assessments using historical weather patterns, and to calculate the economic damages from those outages.
Importantly, our analysis offers guidance on how to do that, providing a process for modeling the reliability of proposed regulations or resource plans and calculating the cost of blackouts. The report should be out around June.
Why Develop the Social Cost of Blackouts?
The EPA and utility commissions routinely employ externality cost estimates for carbon dioxide and other greenhouse gases (GHGs) using a metric called the Social Cost of Carbon (SCC). But these regulators completely ignore the negative externalities their rules or IRP determinations may cause by regulating reliable power plants off the grid or allowing them to be shuttered prematurely to reduce emissions.
This historically unbalanced focus on emissions-related externalities, while ignoring the possible externalities of blackouts, has led to declining reserve margins across the country as regulations and IRPs have favored intermittent wind and solar resources over dispatchable generators.
Furthermore, this practice has severely underestimated the cost of complying with these regulations by either not accounting for the blackouts they cause or building the required capacity to ensure reliability.
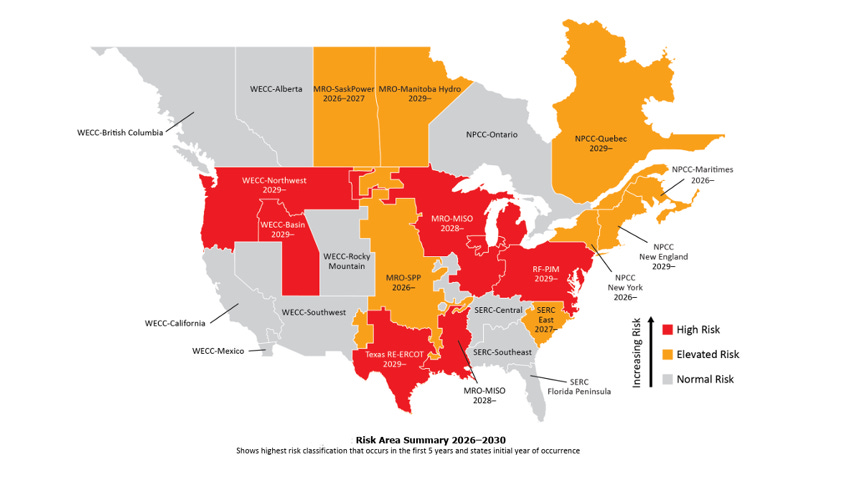
These historical forces, and more recently surging demand from data centers, are partly responsible for how we got a North American Electric Reliability Corporation (NERC) Long-Term Reliability Assessment (LTRA) map that looks like a stock-market meltdown with half the nation at high risk of blackouts by 2030.
The growing risk of power outages resulting from supply shortages across America makes the Social Cost of Blackouts a relevant and necessary tool in the regulatory toolkit to ensure that reliable power plants are not undervalued.
Calculating Blackout Costs
Blackout costs are difficult to quantify because they depend on several factors, including the duration of the outage, the time at which it occurs, whether the outage was expected or unexpected, the weather or environmental conditions during the outage, and each customer’s individual electricity needs.
The difficulty is compounded when we consider that these factors can change widely from day to day.
For example, widespread blackouts on Thanksgiving would result in thousands of very unhappy (and hungry) residential customers, but the economic damages would be minimal because most non-essential businesses are closed for the holiday.
However, if a blackout occurs just 24 hours later, it would derail Black Friday, which is typically the largest single-day for retail sales in the country. Maybe these sales are lost, or maybe they simply happen at a later date, but the economic disruption is real and very tricky to quantify.
In conducting our initial research for the project, we discovered a new tool called the Interruption Cost Estimate (ICE) calculator, developed by the Lawrence Berkeley National Laboratory (LBNL).
While ICE is not without limitations (it is generally good for quantifying the cost of outages no longer than 24 hours), this calculator allowed us to derive defensible estimates of the Social Cost of Blackouts for the Biden Administration’s Final Carbon Pollution Standards in the Midcontinent Independent System Operator (MISO) and Southwest Power Pool (SPP).
Southwest (Without) Power Pool
As we wrote in May of 2024, the EPA’s modeled SPP grid under the Final Carbon Rules was so irresponsibly dependent upon wind and solar generation that it would leave 5.2 million people in the dark if these resources perform as they have historically.
For example, the graph below shows the generation mix for SPP in each of the EPA test years (2028, 2030, 2035, 2040, 2045, 2050, and 2055). As you can see, EPA’s modeled SPP grid would need approximately 20 GW of wind or solar capacity at any given moment to meet projected peak demand, meaning SPP would not be able to weather an evening without wind.
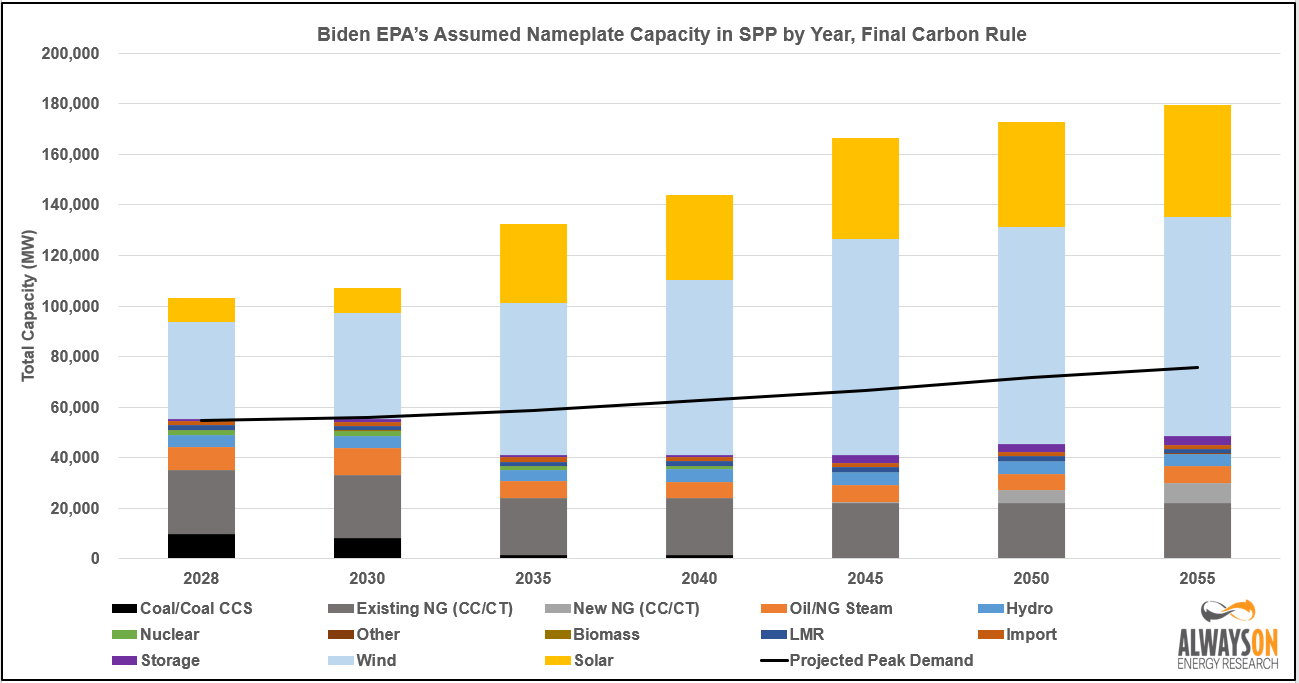
To evaluate the reliability of this system, Always On scaled the hourly generation profiles of SPP—obtained from the U.S. Energy Information Administration’s Hourly Grid Monitor—so that the hourly peak would match EPA’s projected peak.
Then, we used hourly capacity factors for wind and solar from 2019, 2020, 2021, 2022, and 2023 to assess whether the EPA’s estimated installed capacity would be able to serve demand for all hours if wind and solar operate as they have in the recent past.
We found blackouts everywhere.
The graph shows thirteen separate capacity shortfalls that would occur from February 7, 2040, through February 19, 2040, using 2021 hourly electricity demand profiles and wind and solar hourly generation data. The longest of these capacity shortfalls lasts for 41 straight hours. During this stretch, there are more hours with blackouts than without them.
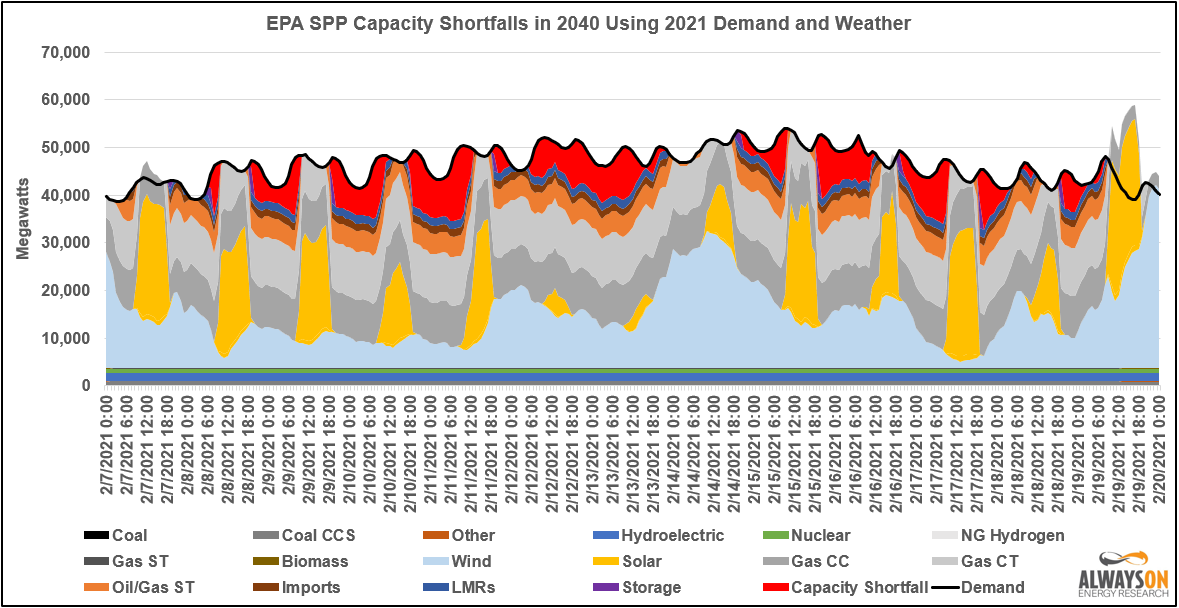
The table shows the number of megawatt hours (MWhs) of unserved load in each of EPA’s model years in SPP for each historical comparison year. Based on 2021 demand and wind and solar production, there would be 8.3 million MWhs of unserved load across these seven model years.

Using the ICE calculator, we were able to translate these outages into economic costs of blackouts, using the worst-case results from the above table as our examples.
Using the ICE Calculator
As we alluded to before, the ICE calculator has limitations. Chief among them that it can only model blackouts of 24 hours or less. As a result, the ICE calculator wasn’t even able to handle the breadth of the blackouts in SPP because they were so massive.
However, we can model most of the blackouts using this tool, and the costs are enormous.
The ICE calculator utilizes three reliability metrics reported by utility companies to calculate the cost of blackouts, such as the System Average Interruption Duration Index (SAIDI), the System Average Interruption Frequency Index (SAIFI), and the Customer Average Interruption Duration Index (CAIDI). SAIDI represents how many minutes of power outages per year the average customer experiences, SAIFI is the number of power outages the average customer experiences, and CAIDI is the average time it takes to restore power.
While utilities utilize these metrics to locate where system improvements are needed, we are using them here specifically to calculate the potential cost of future blackouts arising from inadequate generation portfolios.
It helps here that we only need to find two of these metrics, because they are related to each other by the following formula:

The first step for us is to convert the hourly shortfall data for each test year into two of these reliability metrics, SAIDI and CAIDI, which are the easiest to find given our data.
For SAIDI, we need to figure out the equivalent number of hours that went unserved for the average customer. We can do this by dividing the total annual MWhs of shortfalls by the average hourly load of the system. For CAIDI, we simply find the average length of every shortfall event in each test year.
From here, we can derive SAIFI by dividing SAIDI by CAIDI.
The Cost of SPP Blackouts
Using the ICE model, there are three interesting ways to examine the cost of blackouts: the total cost of the blackouts, the cost per MWh of unserved energy, and the cost of the blackout per avoided ton of carbon dioxide. The ICE model derives the first two, while for the third, we need to divide the total cost by the total avoided tons of carbon dioxide based on our modeling.
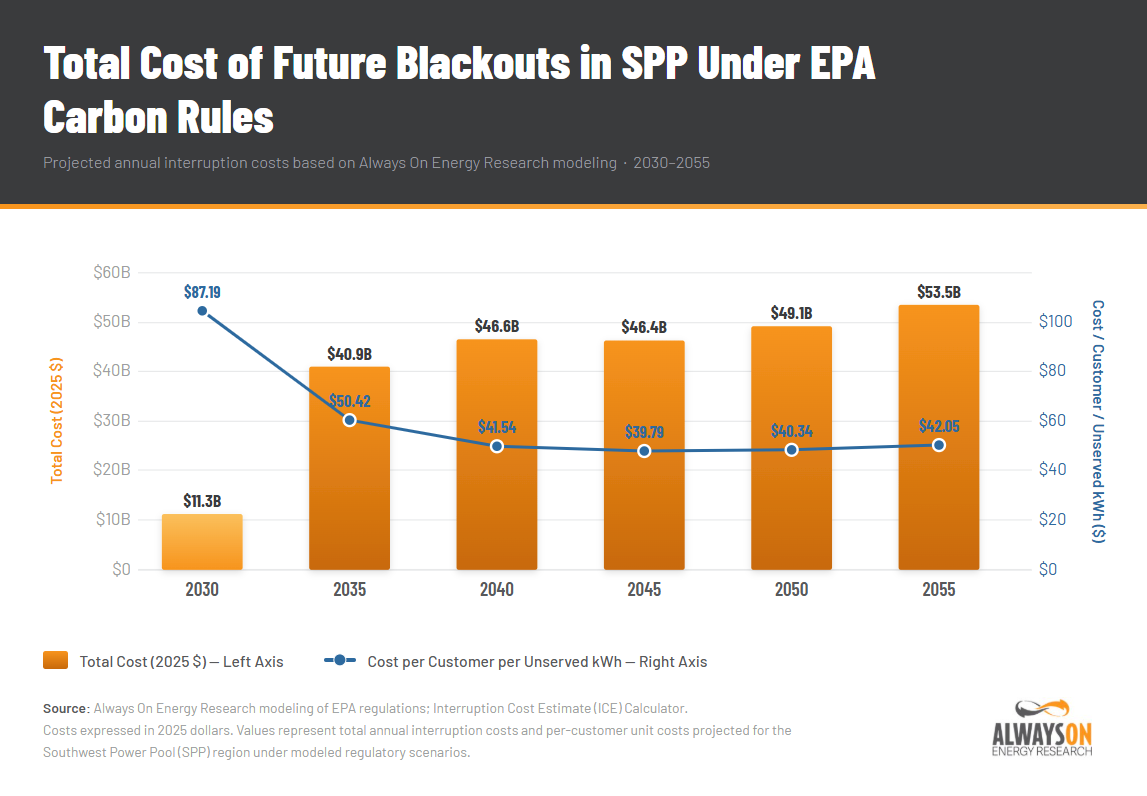
The graph below shows the total cost of blackouts in SPP based on our modeling of EPA regulations.
As mentioned before, the SAIDI value is maxed out in the ICE calculator from 2040 to 2055. Due to customer growth, the total cost of the blackouts increases through 2055, starting at just over $11 billion in 2030 to over $53 billion in 2055. The cost per customer per MWh unserved, on the other hand, starts higher and drops as the blackouts get larger and longer because the model utilizes survey data that shows the most expensive MWhs to customers during blackouts are the early ones, and each incremental hour is less expensive than the one before it.
The implications of this are massive.
In one RTO alone, by severely underbuilding the grid and relying too much on wind and solar to meet peak demand, the EPA missed potentially $1.1 trillion in economic costs resulting from blackouts from 2030 to 2055 when extrapolating the data for years in between the test years. And once again, the ICE model wasn’t able to capture how bad the data for SPP truly was, so this value is even higher.
The graph below highlights the annual cost per ton of carbon dioxide averted from 2024 emission levels, which increases from $300 per ton in 2030 to $504 per ton in 2055.
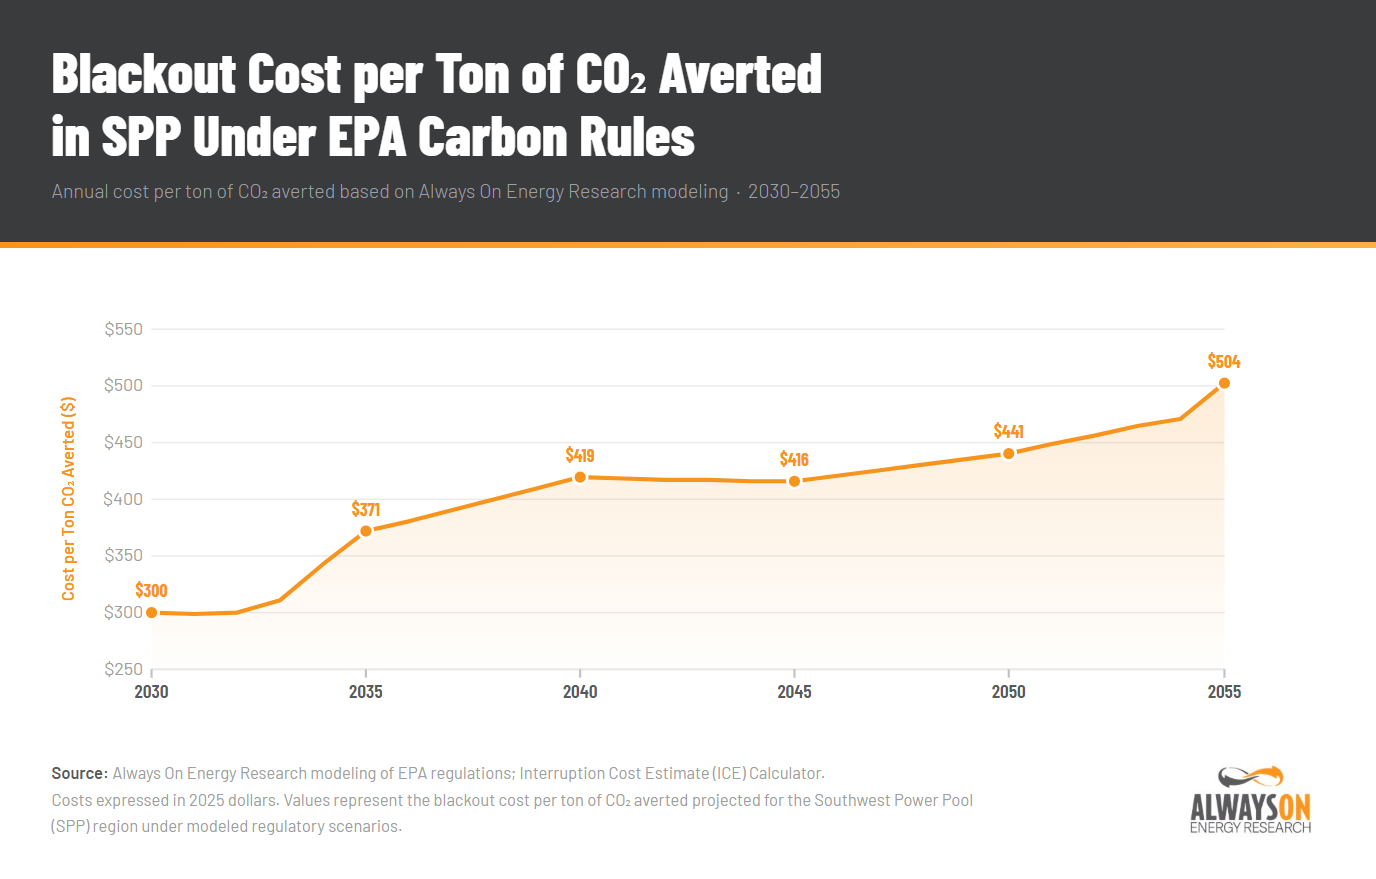
Needless to say, the cost of avoiding carbon emissions far exceeds the cost of using fossil-fuel generation to reliably serve electricity demand.
Conclusion
This is just one example of how calculating the Social Cost of Blackouts can be useful for bringing reliability back to the forefront in ways that matter for energy policy.
Metrics like the social cost of carbon are arbitrary, incomplete, and uncertain. Blackouts have a very real and direct cost on society. And by not accounting for the reliability impact of generation mixes heavily dependent on intermittent and weather-based resources like wind and solar, resource planners and policymakers have been ignoring trillions of dollars arising from their proposals.
Energy policy has been careless for decades on this front, and we’re now starting to pay the price of those mistakes. Electricity prices are through the roof, and almost every grid in the country is struggling to make room for an energy-intensive data center industry despite having more capacity than ever before. The grid is supposed to be designed to best serve load growth while maintaining reliability at an affordable cost to society, and it has failed in this regard.
The issue, of course, is that the capacity we’ve been building (wind and solar) is next to worthless when it comes to reliability, and therefore it’s expensive. This is what happens when reliability considerations take a backseat to climate policies, and the Social Cost of Blackouts is meant to change that.
This piece was originally published at Energy Bad Boys on Substack, April 18, 2026.